
Blog

-
8 min
read
Since we build software nowadays differently than a couple of years ago, performance testing alone isn't sufficient anymore. Learn how to profit from the synergy of performance testing and Chaos Engineering - a symbiosis of k6 and Steadybit.
Software development is entirely different today than it was a few years ago. Back then, we usually had a big monolith running on our own hardware. We mainly did performance tests to see if the hardware resources were sufficient to handle the load. Today, we develop software in a distributed environment with multiple services which may even run on different cloud platforms. With performance testing, we try to identify performance and resilience issues in these kinds of environments. However, we always assume a working system, looking for a breaking point by putting it under heavy load. What we overlook is the fact that the underlying platform, infrastructure and even the system under test do not always function to the full extent we would like. No matter how much effort we put into it, we can’t prevent it from happening. This is exactly where the symbiosis of k6 - as a performance testing tool - and Steadybit - as a resilience platform - comes in.
k6 is an open-source load testing tool for testing the performance of APIs, microservices, and websites. Developers use k6 to test system performance under load to catch performance regressions or errors.
Steadybit is a resilience platform based on chaos engineering principles. Developers use it to determine how their system behaves under turbulent conditions. The platform helps them to find vulnerabilities and regain control over reliability.
In this blog post, we will first write a performance test using k6 and then re-use it in a resilience experiment in Steadybit.
Let’s get started: Our System Under Test
In our context, we use a fairly simple example of a system under test. It is an online shop consisting of five microservices: a microservice for each of the product categories offered in the shop (fashion, hot-deals and toys) and a microservice that orchestrates all the products and presents them to the user via a web front-end (gateway and shopping-ui). All communication between the microservices is done via REST without any caching. You can get further information via the project’s GitHub repository.
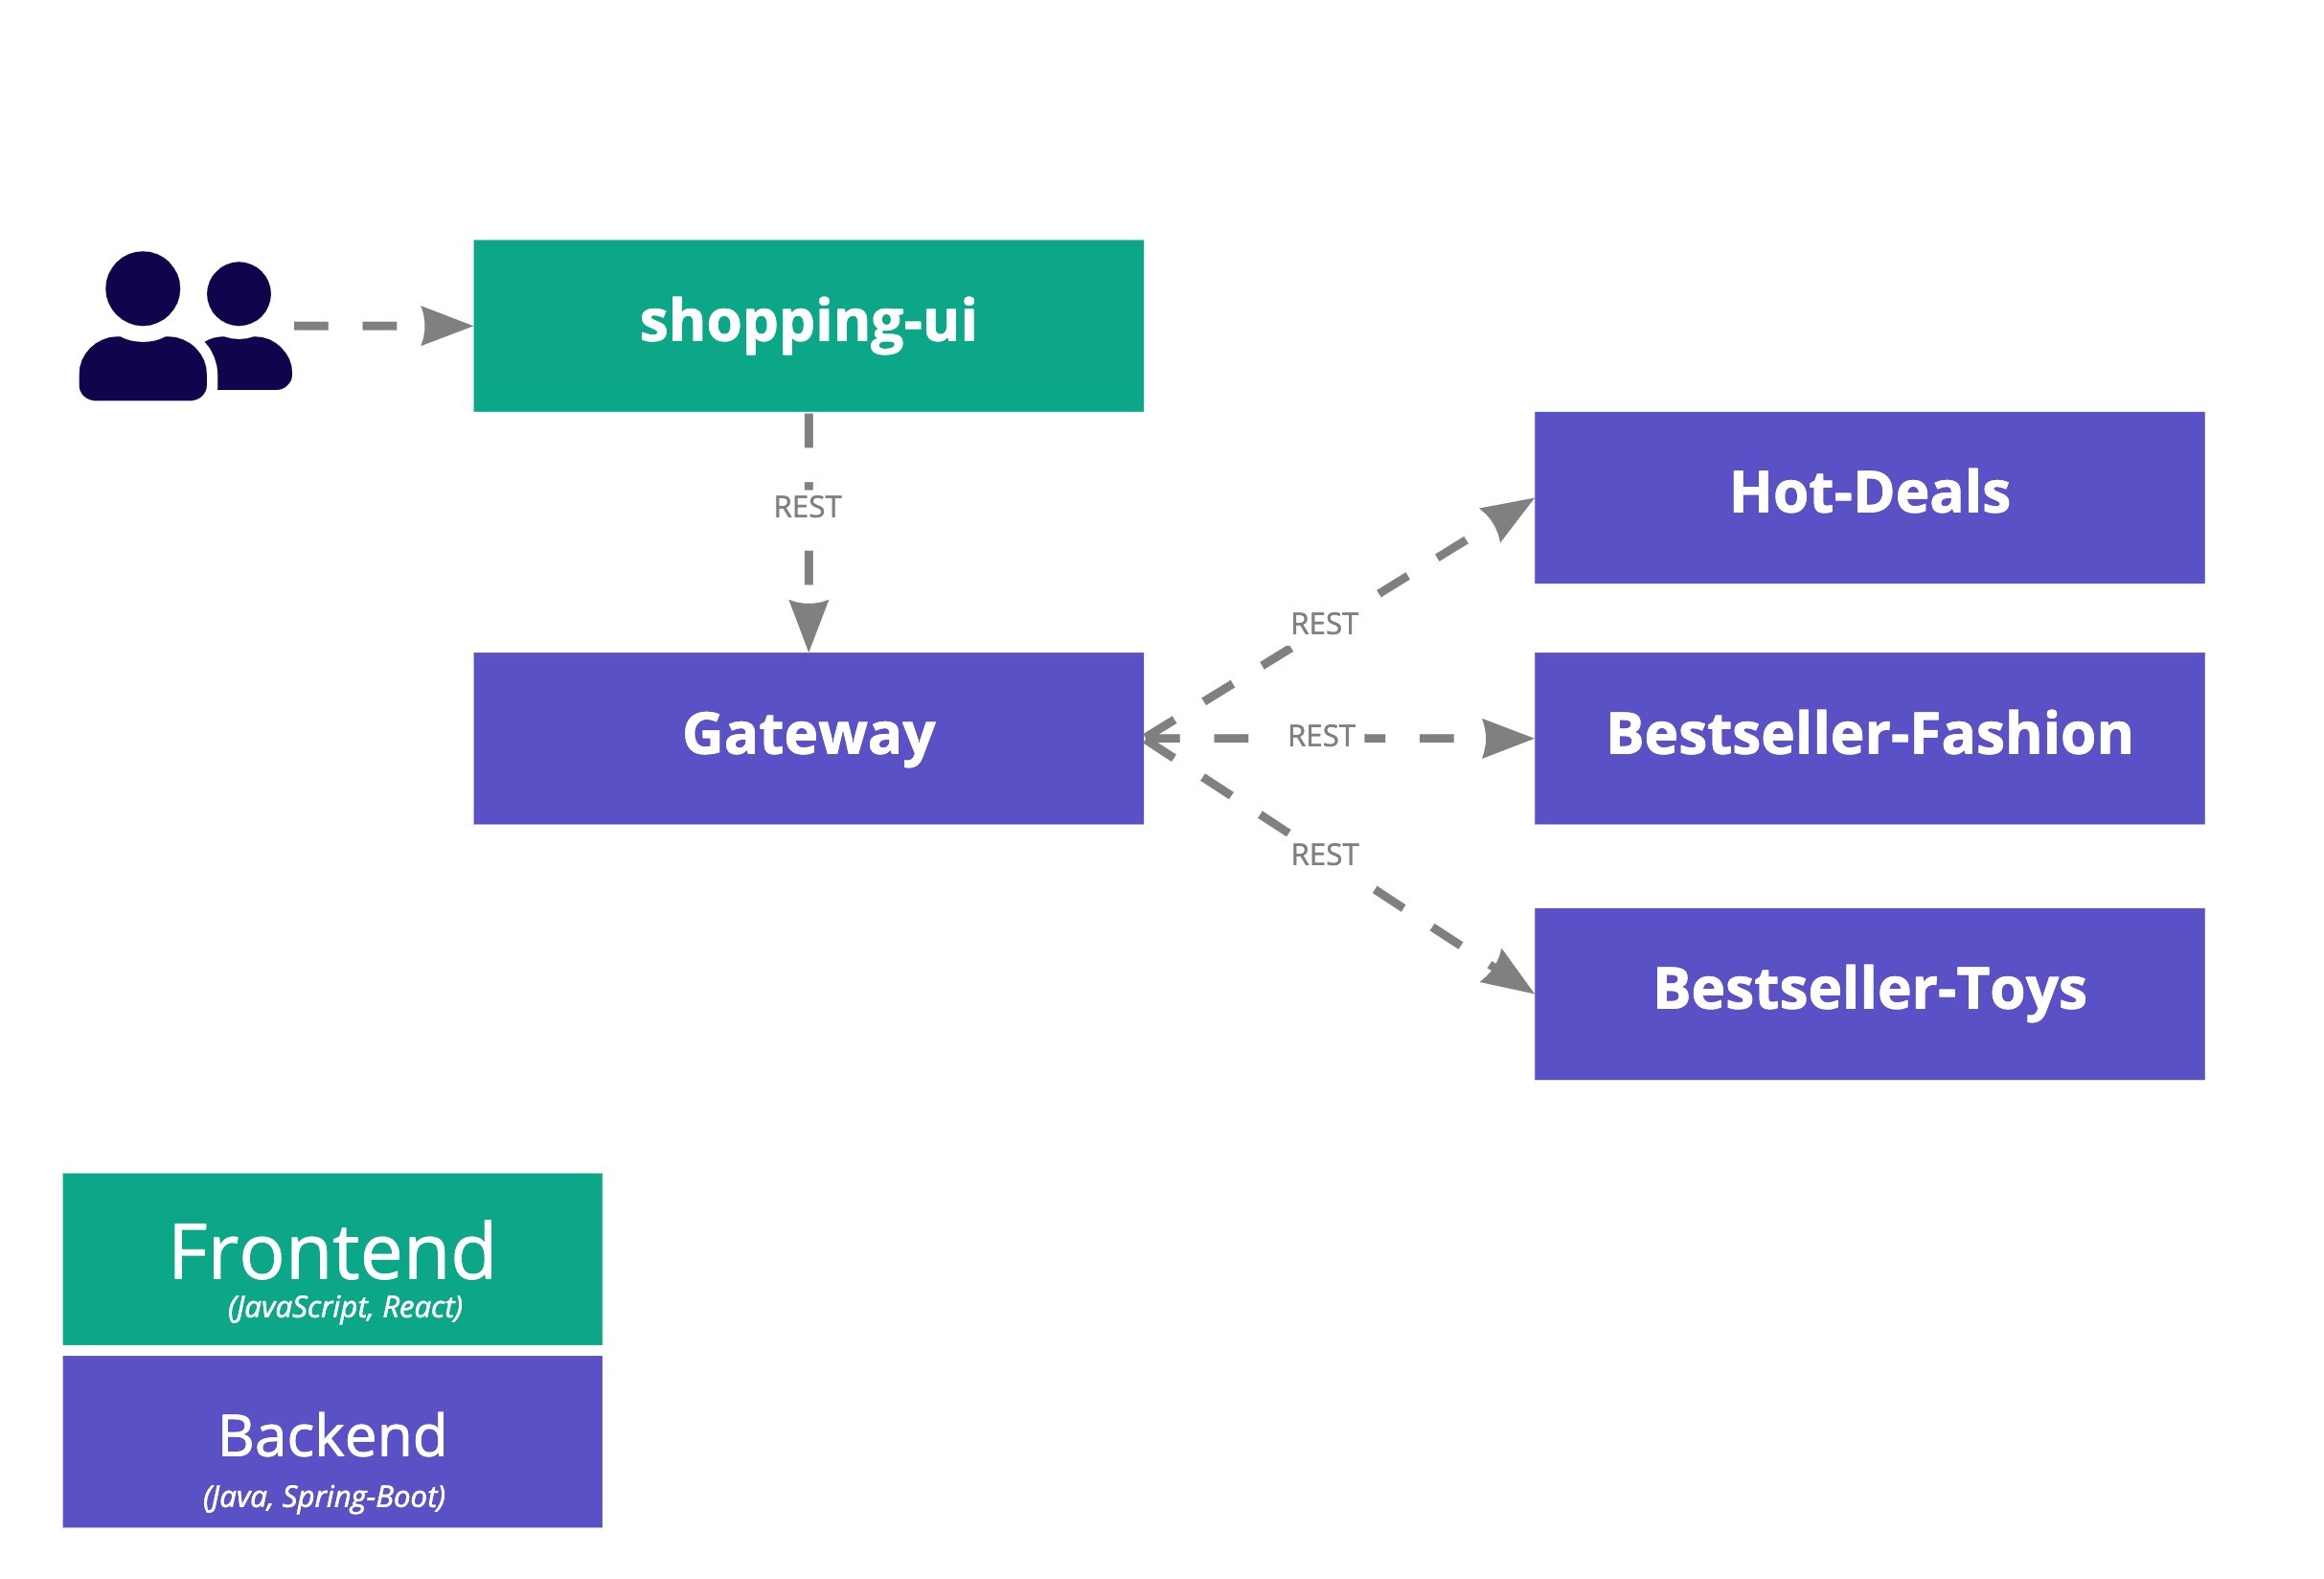
In this blog post, we’ll first performance test the online shop to check whether it is able to handle 50 simultaneous users, frequently accessing the shop. In case of success, we extend the scenario to check how the shop behaves when in addition one instance of a product-related microservice (e.g., fashion) is unresponsive. The former is implemented via a performance test in k6, the latter one via a resilience experiment in Steadybit.
Writing a Performance Test
We start by learning how to write a performance test in k6. With each step, the existing script is improved and our knowledge is expanded. The performance test consists of the following elements:
Create a test script to request an HTTP endpoint of our system under test.
Adding a load configuration to define the duration of the test and the number of virtual users
Implementing a performance goal or service level objective expressed as a success rate of HTTP requests
Verifying the performance goal by running the performance test
Create a Test Script
First, we define the test script that simulates a virtual user accessing the /products endpoint of our shop's gateway. To avoid overloading the system under test, we put the virtual user to sleep for one second after each request.
Add Load Configuration
We add the load configuration to stress the system in the next step. We use 50 virtual users who each request the /products endpoint, sleep for one second, and then repeat - for a total duration of one minute.
Define Performance Goal
The final step in writing our performance test is to define the performance goal. This can be done in k6 using Thresholds.
We want to ensure that less than 1% of requests fail (no HTTP 2xx or 3xx codes returned) and the 95th percentile response time is less than 250ms throughout the test.
Verify Performance Goal by running the Performance Test
Finally, we can run our performance test by executing the command:
The output should look similar to the one below, meaning that the threshold has been met and our online shop handles the load.
Are we safe? Resilience Testing as the Next Step
So far, everything has been as usual, using only k6. However, we have done our load test under perfect conditions, where everything works as expected. We don't know about your experience operating production environments, but we believe that peace and harmony are often missing in production environments. Instead, failures are common and operational handbooks are typically missing or incomplete. For example, a single instance is just crashing, not responding, or being re-deployed due to an update. Per Murphy's Law, it always happens at peak times.
Let's find out if our online shop is safe. Each microservice is packaged as a container image defined by OCI (Open Container Initiative). These containers are deployed into a Kubernetes cluster with a redundancy of 2 pods per microservice. So, we assume that if one instance of a microservice fails, the other will take over, while Kubernetes will detect and replace the failing instance quickly. This blog post focuses on a non-responsive instance of the product microservice fashion. So we test whether our online shop works within its performance goals even if one instance of fashion does not respond. Just as a recall, our performance goals are that less than 1% of requests fail (HTTP 4xx or 5xx codes returned), and the 95th percentile response time is less than 250ms.
This is where we hook in by writing our first resilience test with Steadybit. If you haven't worked with Steadybit before, you can get started for free by creating your account and installing the agents in your environment.
We follow the steps below to integrate our k6 load test into a newly created resilience experiment in Steadybit.
Create a new resilience experiment in Steadybit
Integrate load test into the resilience experiment
Run our resilience experiment
Create Resilience Experiment
Once you have signed up for your Steadybit account and installed the agents, you can log in to the Steadybit platform, go to the Experiments tab and create a new experiment using our wizard. The wizard guides you through all the essential aspects of a resilience experiment.
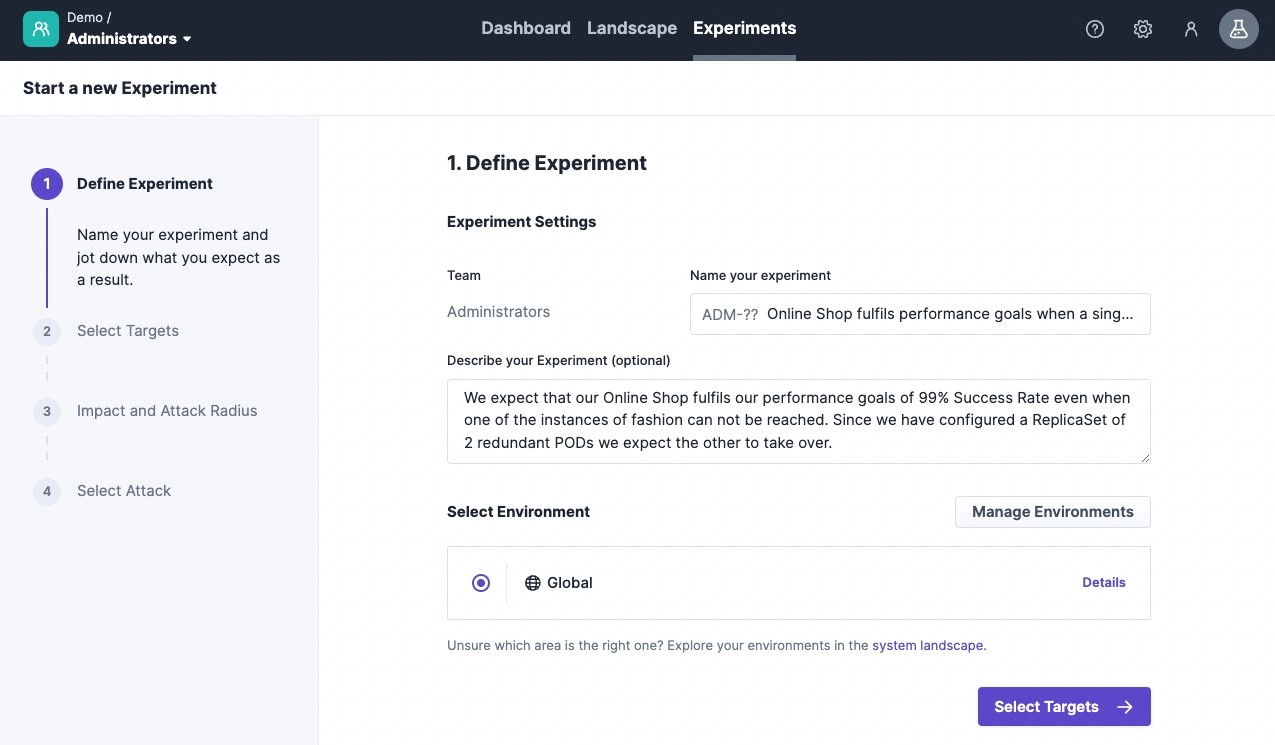
1. Define Experiment: We start by giving the experiment a meaningful name, describe our expected outcome, and choose the right environment (‘Global’ being the default for everything that the Steadybit agent has discovered).
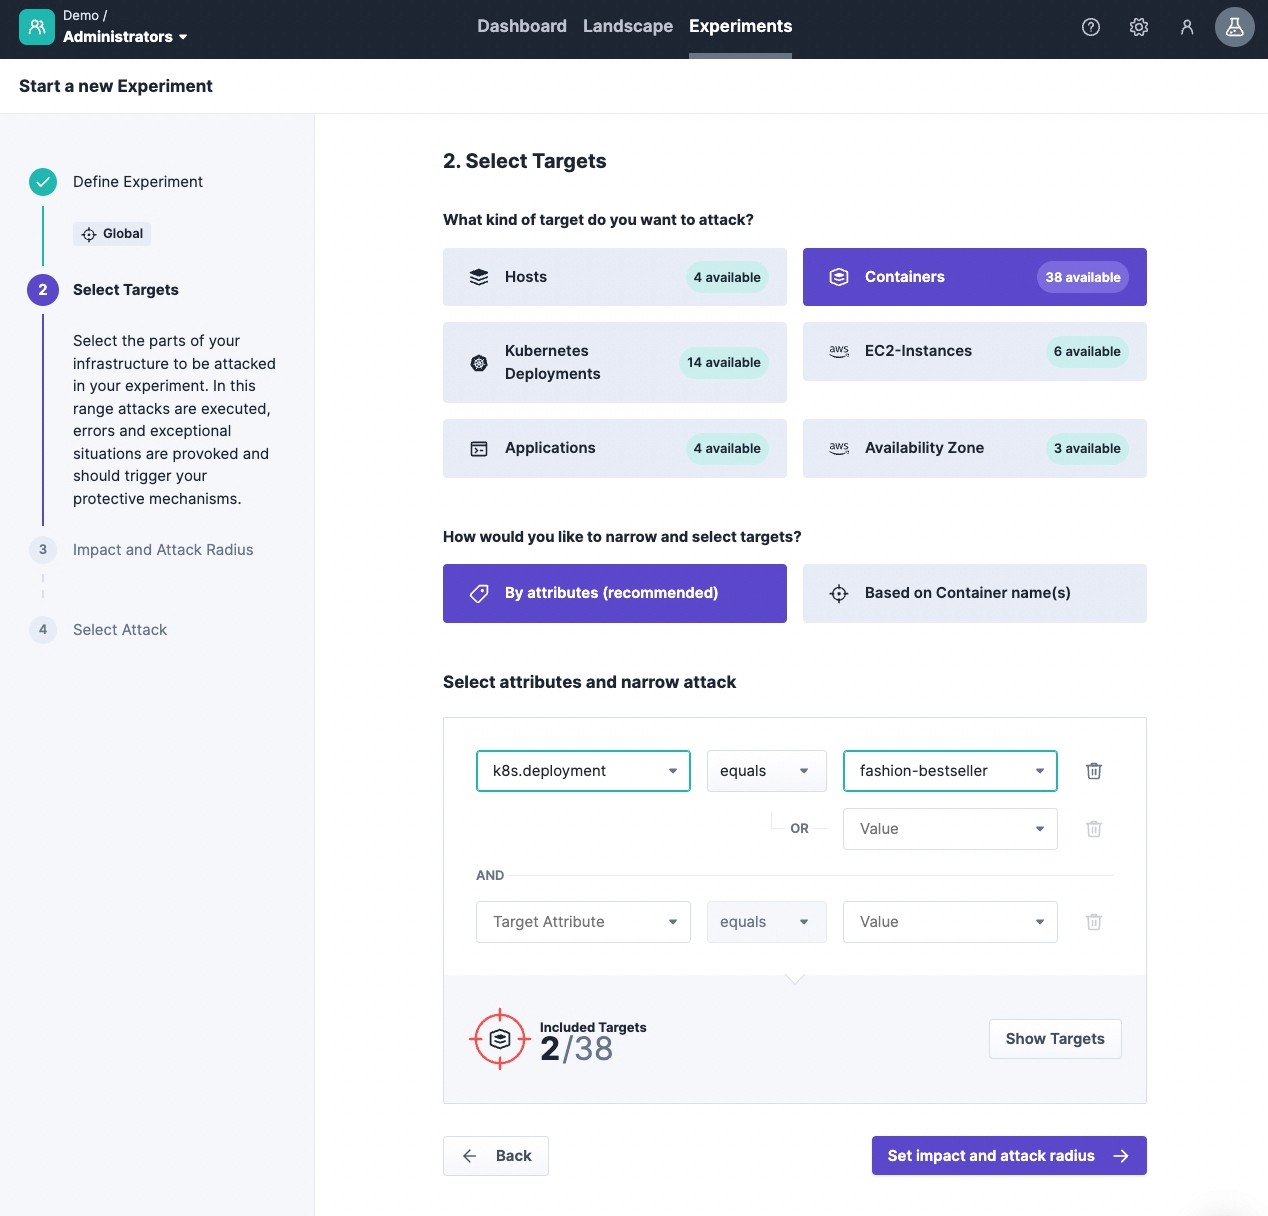
2. Select targets: Next, we define the target of our experiment - as said, in our case, the Docker container of our Kubernetes Deployment fashion-bestseller. We can easily use the discovery data of the Steadybit agents to select the right one.
3. Impact and Attack Radius: Since we have two instances of fashion running, we can choose how many we want to attack in the next step. We keep the default setting of one, as we want to determine whether the working instance of fashion takes over.
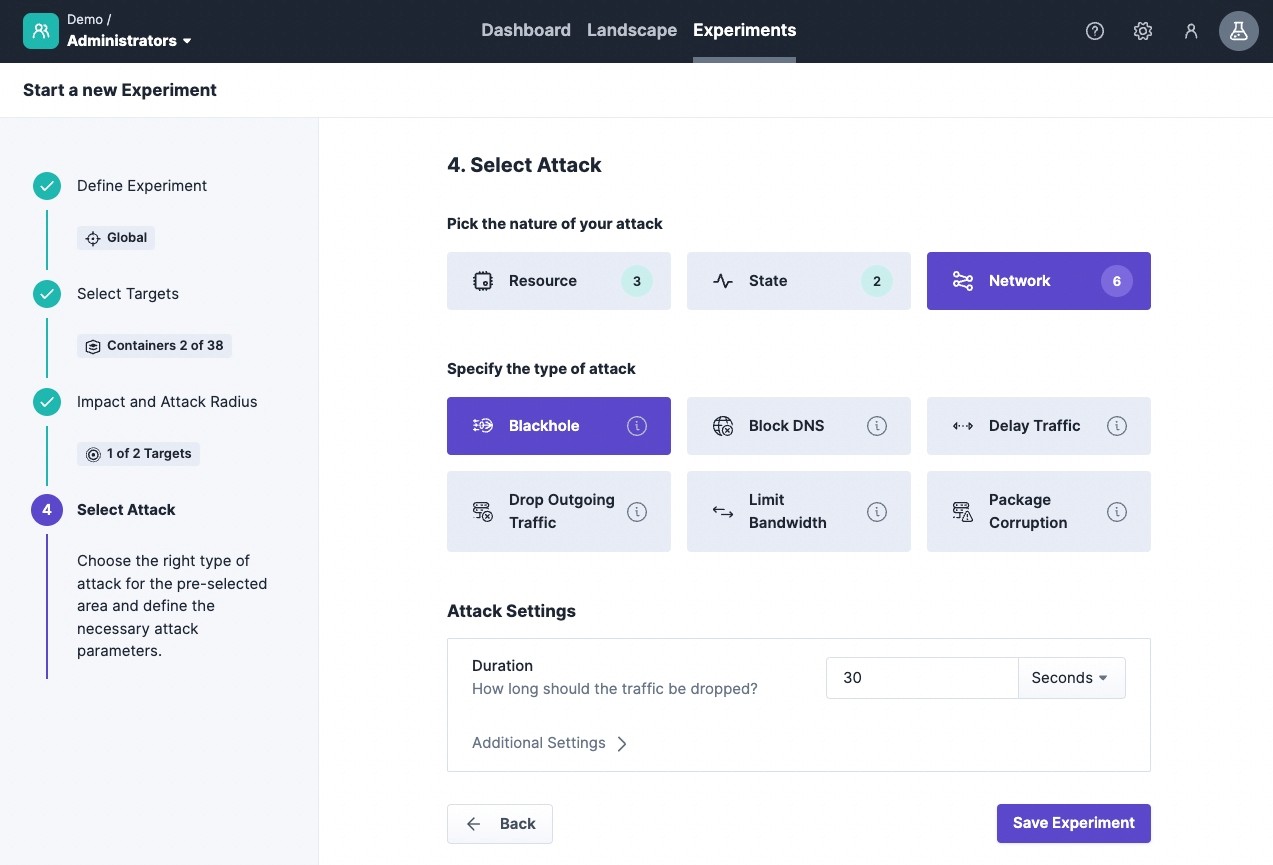
4. Select Attack: In the last step, we determine how we want to influence the system, so which turbulent condition we want to introduce. For the simulation of an unresponsive microservice, the network blackhole attack is well-suited as it completely isolates the Docker container. We select the attack from the Network category and close the wizard by clicking 'Save'.
The resilience experiment is now successfully saved in Steadybit and ready for use. Now, we can integrate the k6 load test to run it as part of our experiment.
Integrate Load Test into Resilience Experiment
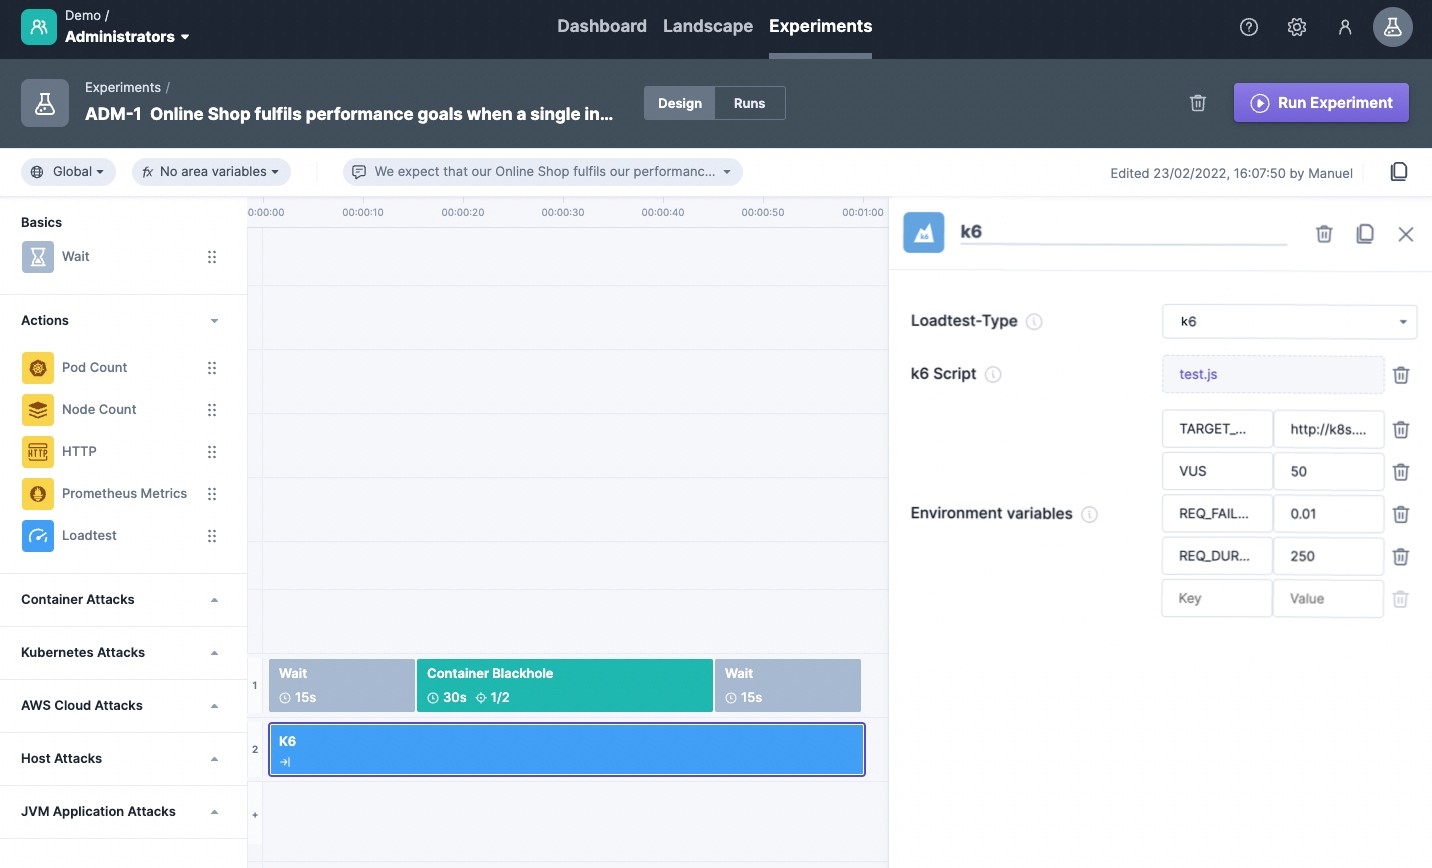
After completing the wizard, we can use drag and drop to add further steps. It might be a good idea to add wait steps of 15 seconds before and after the attack to see the behavior of our tested system under normal conditions. Finally, drag and drop the load test item from the ‘action’-category. The default testing tool is already set to k6.
Before we upload our written k6 load test, we should replace the one-minute fixed duration with a JavaScript variable. Steadybit has a built-in environment variable called `DURATION` (line 6). This way, we ensure that the load test runs as long as the experiment runs. We can also define our own variables, such as the number of virtual users and the target URL (see below). Last but not least, upload the load test into Steadybit.
You should now see an experiment design like the one below and a load test configuration as visible in the toolbar on the right-hand side.
Run our Resilience Experiment
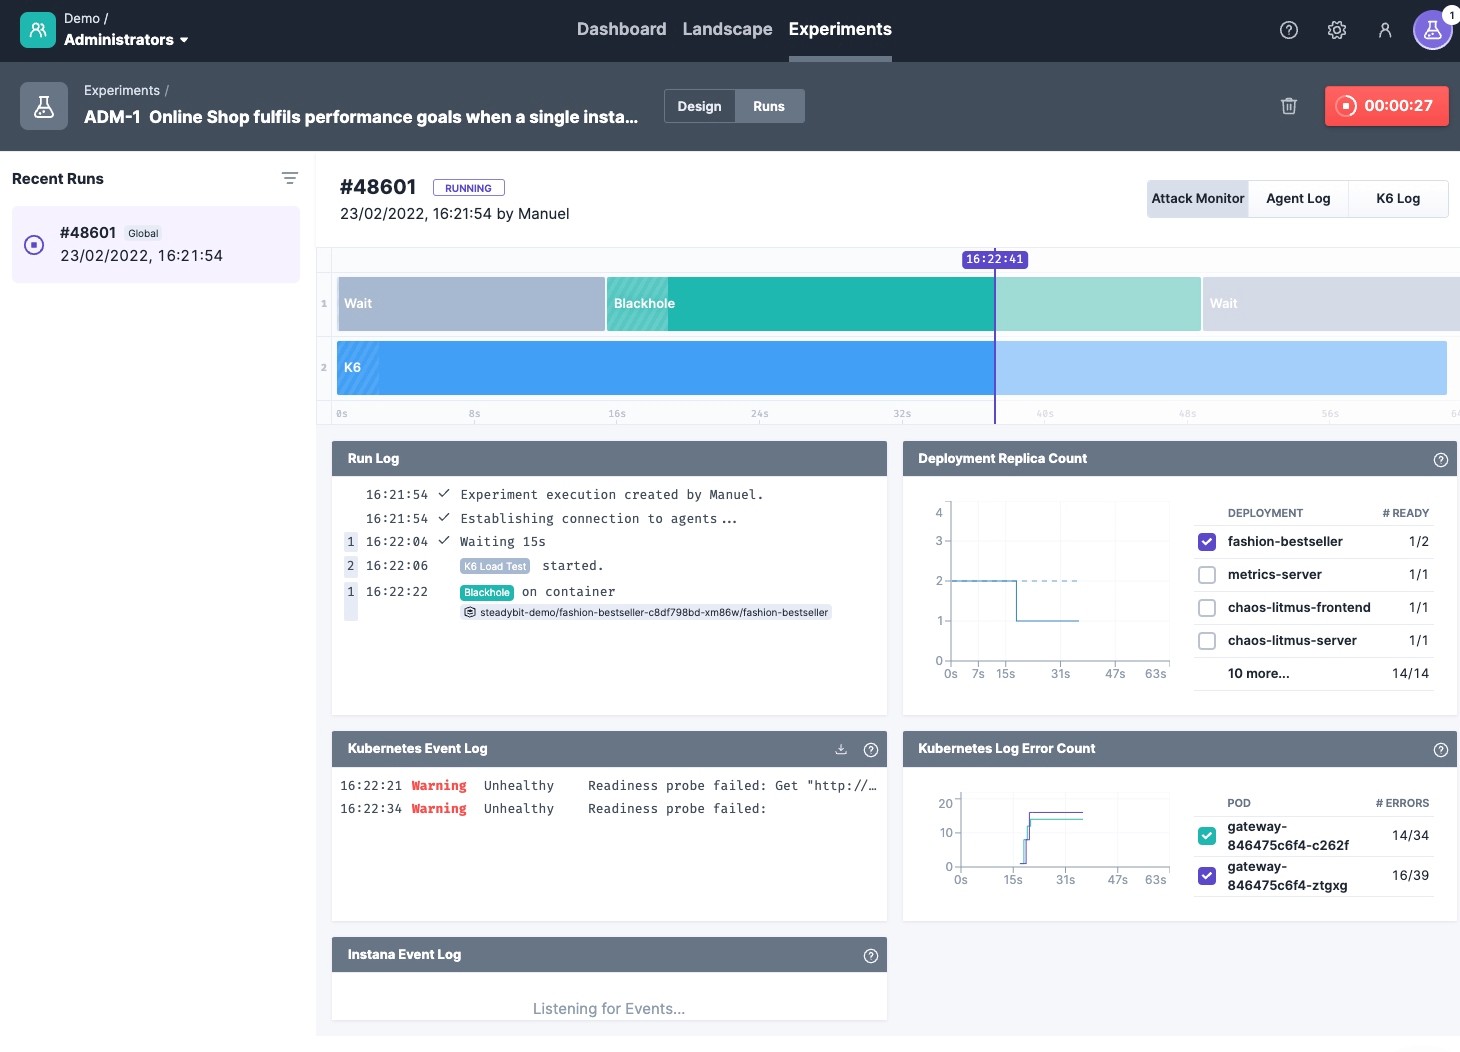
That's it! Let's learn how our online shop behaves by clicking on Run Experiment. The Steadybit UI jumps to the ‘runs’-dialogue, where we get details about what is happening in our system. At the same time, the platform connects to the necessary agents, transfers the load test to an agent and starts running the experiment (this means it is also possible to test non-public URLs).
In the meantime, we can see the experiment progress in the Attack Monitor and verify that the blackhole attack is performed in parallel to the load test. Underneath, we see all the effects in our system. For example, you can see that the error logs in the gateway are increasing (see widget ‘Kubernetes Log Error Count’) and that Kubernetes restarted the isolated Docker container fashion-bestseller after some time due to failed health checks.
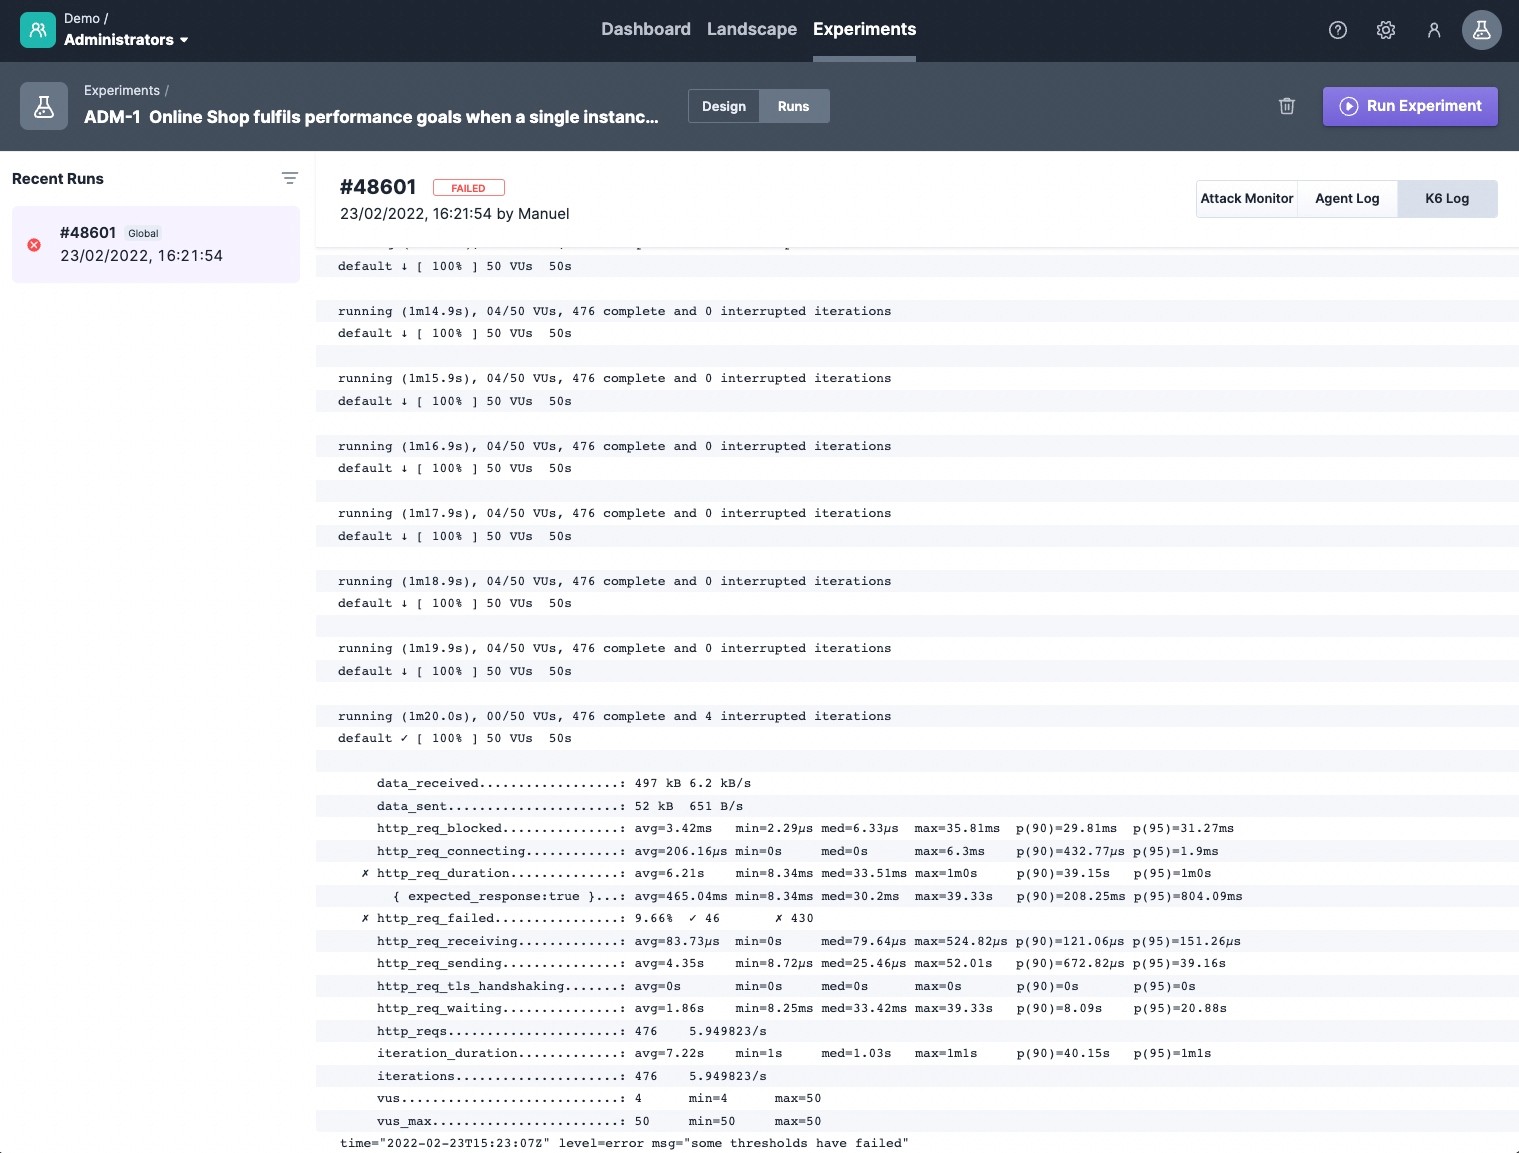
Let's inspect the k6 log to get more information about our load test. Scrolling through the logs, we find some HTTP request timeouts. At the end of the load test logs, we can see in the k6 summary that our defined threshold of just 1% failed requests and 95% percentile of <250ms was not reached. Thus our performance goal was not achieved.
How to fix the System Under Test
Now that we know that the performance goal is not achieved when a single instance does not respond, we can consider fixing the problem. In our case, we can see from the logs that the load balancer was trying to access fashion-bestseller's blackholed Docker container for too long which results in mulitple request timeouts (see screenshot below).
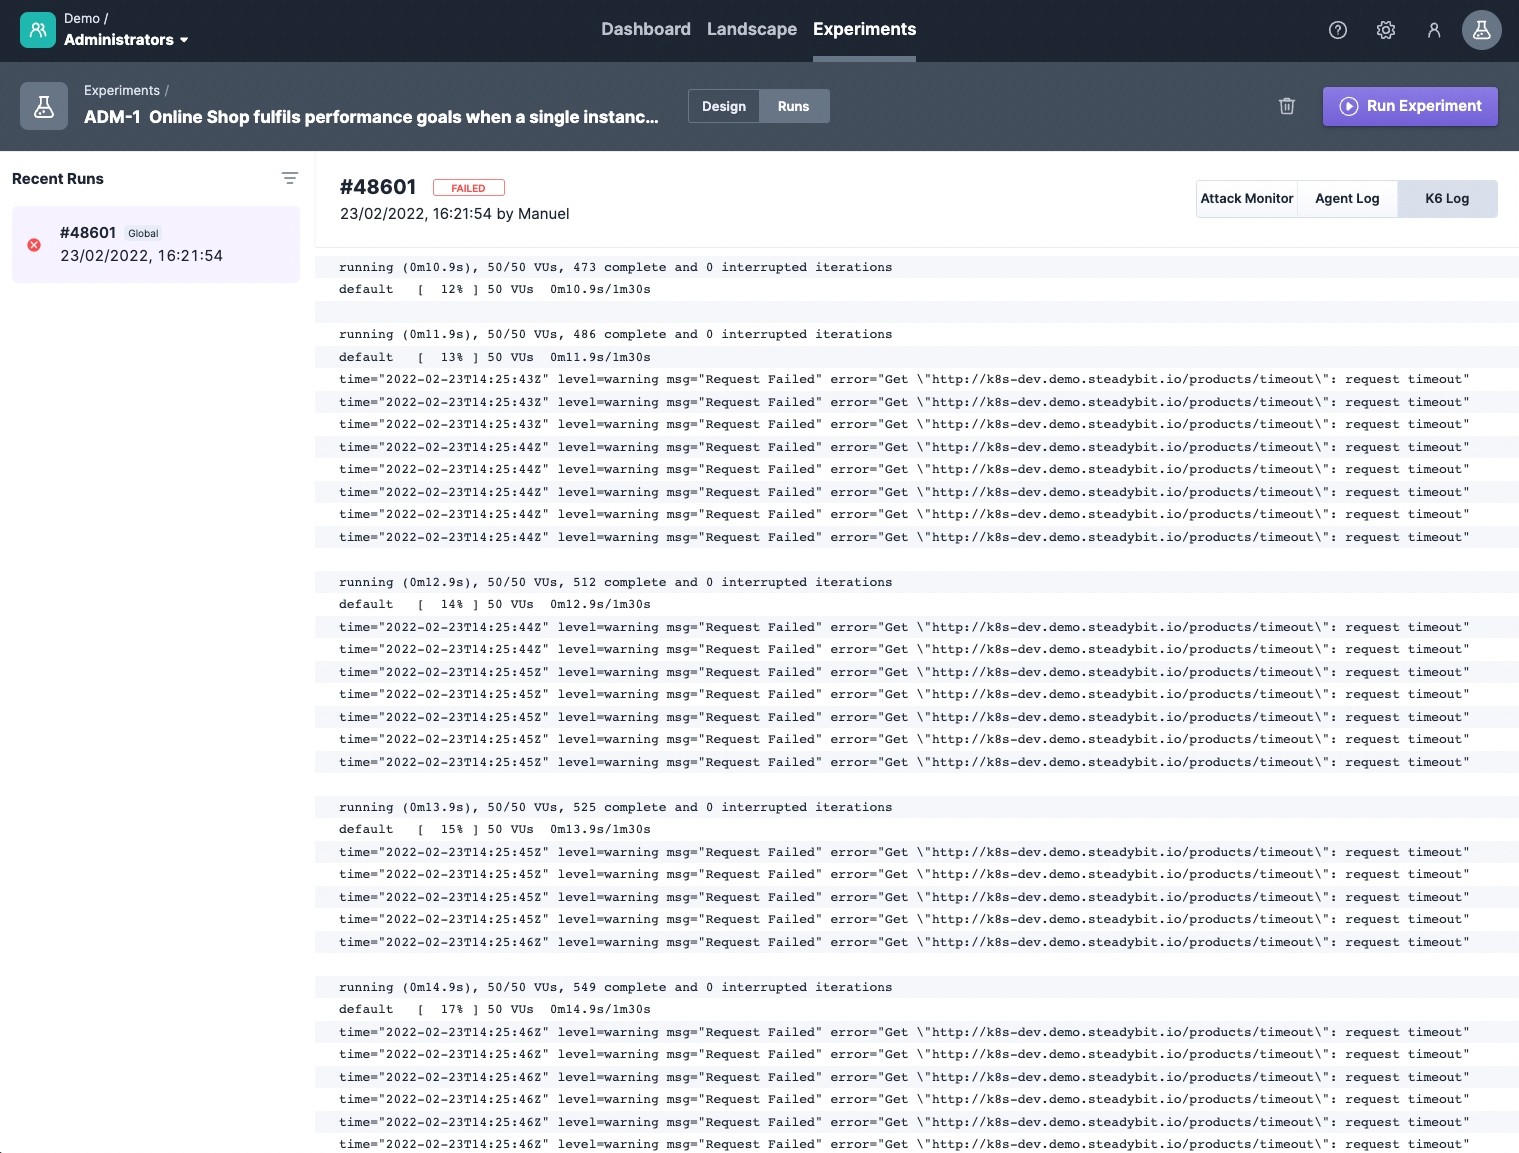
For improving this, we could fine-tune the readiness-probes to improve load balancingby reducing, e.g., the `periodSeconds` between each probe and the `failureThreshold` until a pod is considered not ready. Of course, this can also have adverse effects that we should consider.
Conclusion
In this blog post, we have learned together which possibilities we can profit from when Chaos Engineering meets Load Testing. We started by learning how to write a k6 performance test and checking how our system behaves under load. Afterwards, we enhanced the performance test with Chaos Engineering. To avoid rework, we used Steadybit's k6 integration to run the performance test while applying turbulent conditions. Testing your system's behavior under turbulent conditions is crucial, as production is rarely a happy place and always has some turbulent conditions waiting for you.
In our case, we validated whether we still achieved our performance goals in the case of a non-responding instance of a microservice. Thanks to the Steadybit Chaos Engine, we could easily validate infrastructure configuration changes and ensure the performance goals are now met.
Alternative Approach
As an alternative approach, k6 could trigger the resilience experiment by calling the SteadyBit HTTP API within a k6 Scenario. In this case, k6 runs the load test as usual and starts the chaos experiment with an independent k6 scenario.
More about this approach in an upcoming post!