Elevating Chaos Engineering Experiments to the Next Level
The real world is complicated – especially true for distributed systems. This pushed Steadybit’s experiment engine to their limits when trying to represent the real world (AKA production) in a very simple experiment. In this blog post, we’ll unleash a set of new experiment features that address these shortcomings – and are already loved by many of our users.
Let’s replay real Incidents
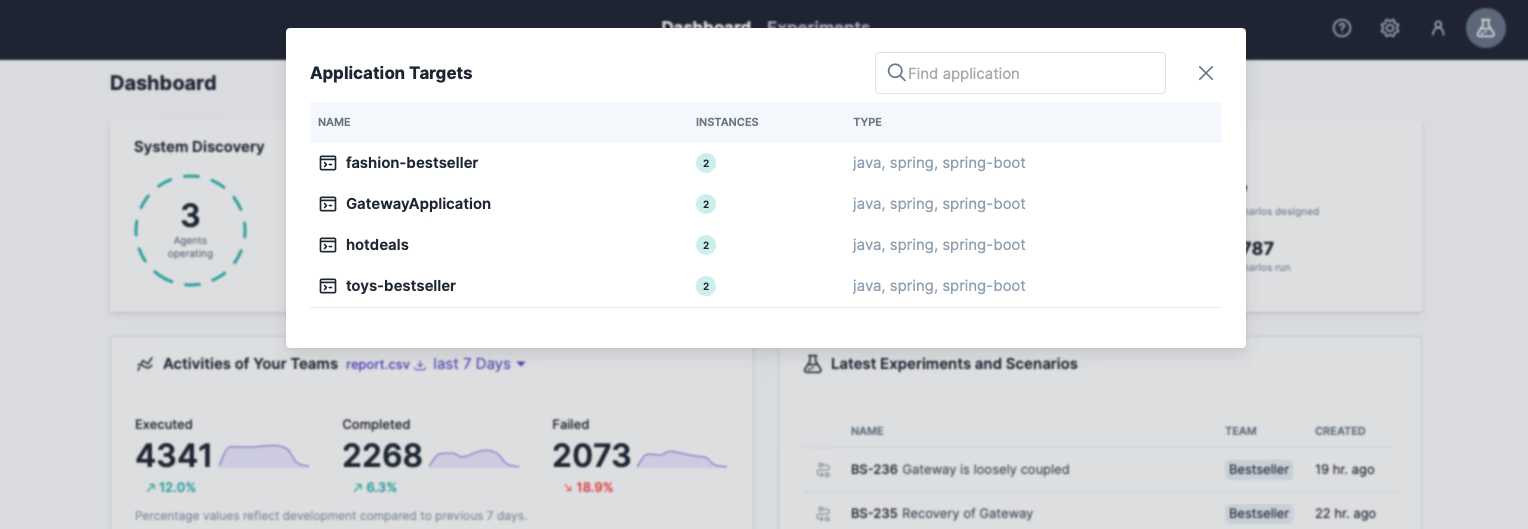
As an attentive reader, you may be familiar with our other blog posts covering simple experiments to survive an AWS zone outage, testing exception handling of REST endpoints and revealing top 3 Kubernetes weak spots. Now we want to test more complicated examples, such as a rippling container outage, a slow network combined with package corruption, or a DNS failure that occurs at the exact moment a container restart is performed. In this blog post, we will verify the last point and start by simulating a simple DNS failure. For that, we use the online shopping demo application, which consists of a microservice gateway that periodically requests products from other microservices over HTTP (Hot-Deals, Fashion-Bestseller, and Toys-Bestseller). See Shopping Demo’s GitHub repository for more details.
Since Steadybit has already discovered our system, we can use the known wizard for experiments. Just follow the steps below to create this experiment yourself. If you don’t have Steadybit in use yet, let’s meet for a short demo call.
Step 1: Create DNS Outage Experiment
We start on the Steadybit dashboard to create an experiment, which leads us to the familiar wizard.

- We give the experiment a meaningful name (e.g., “Gateway survives DNS outage”) and choose the “Global” area (providing you full access to all discovered targets).
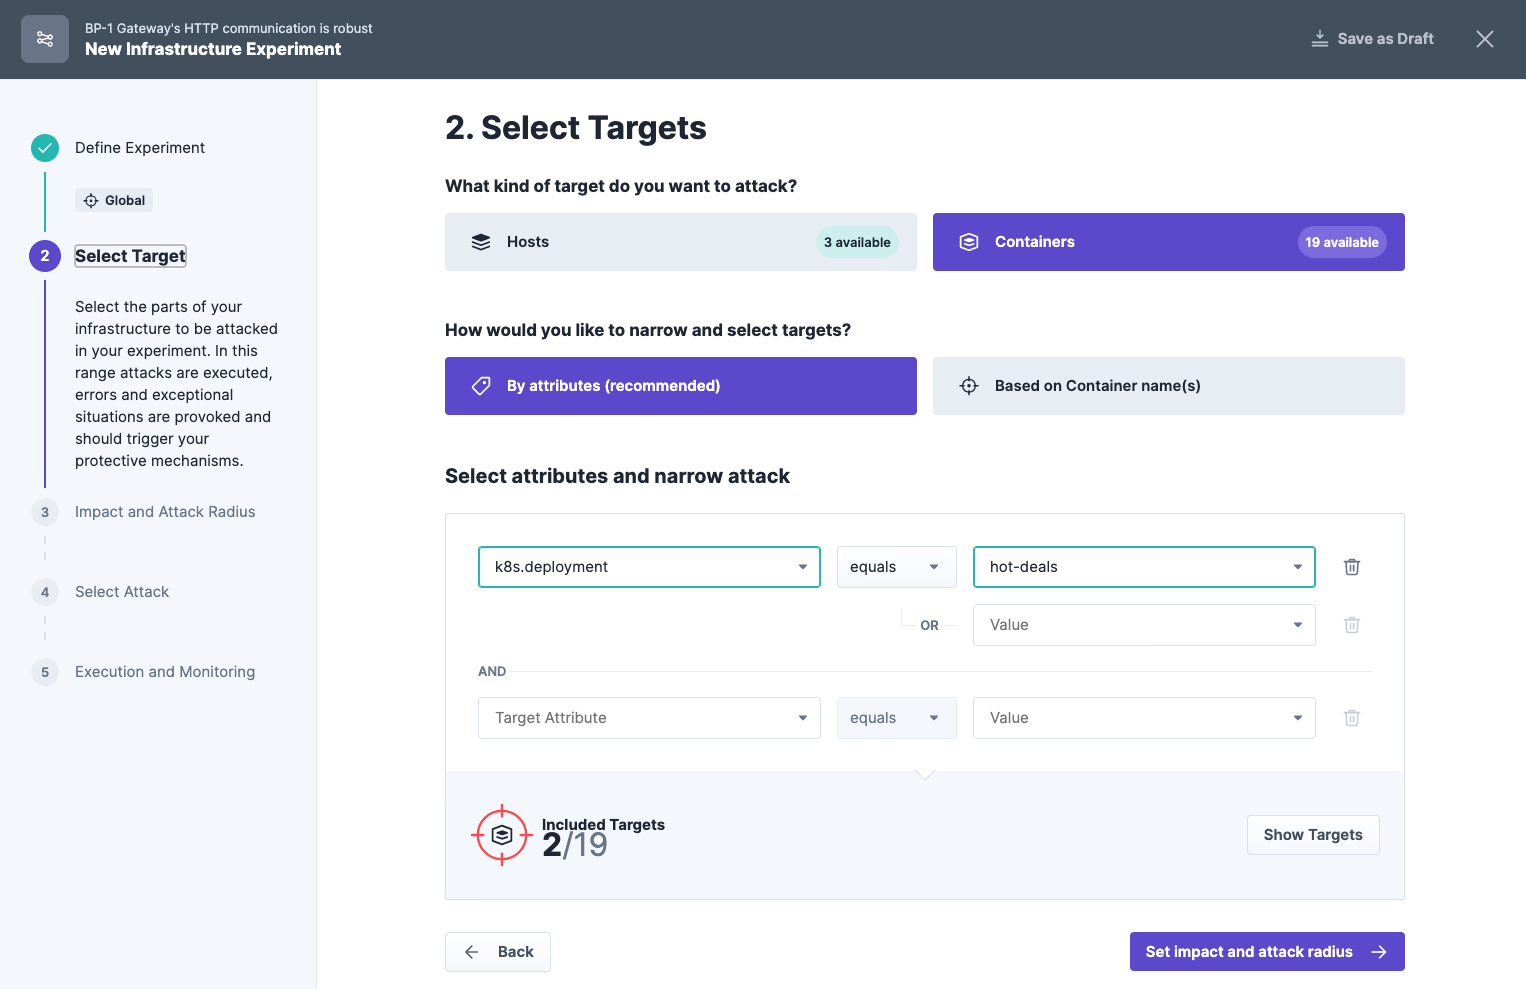
- We decide to attack containers and specify them by attributes. The query narrows down the DNS outage to the gateway microservice only, leaving the remaining deployments untouched.
- Since we want to achieve a maximum effect, we choose an impact of 100% in the following step of the wizard – we attack the containers of both pods of the deployment.
- In the last step, apply the “DNS Failure” attack from the “network” category and finish the wizard by saving our experiment.
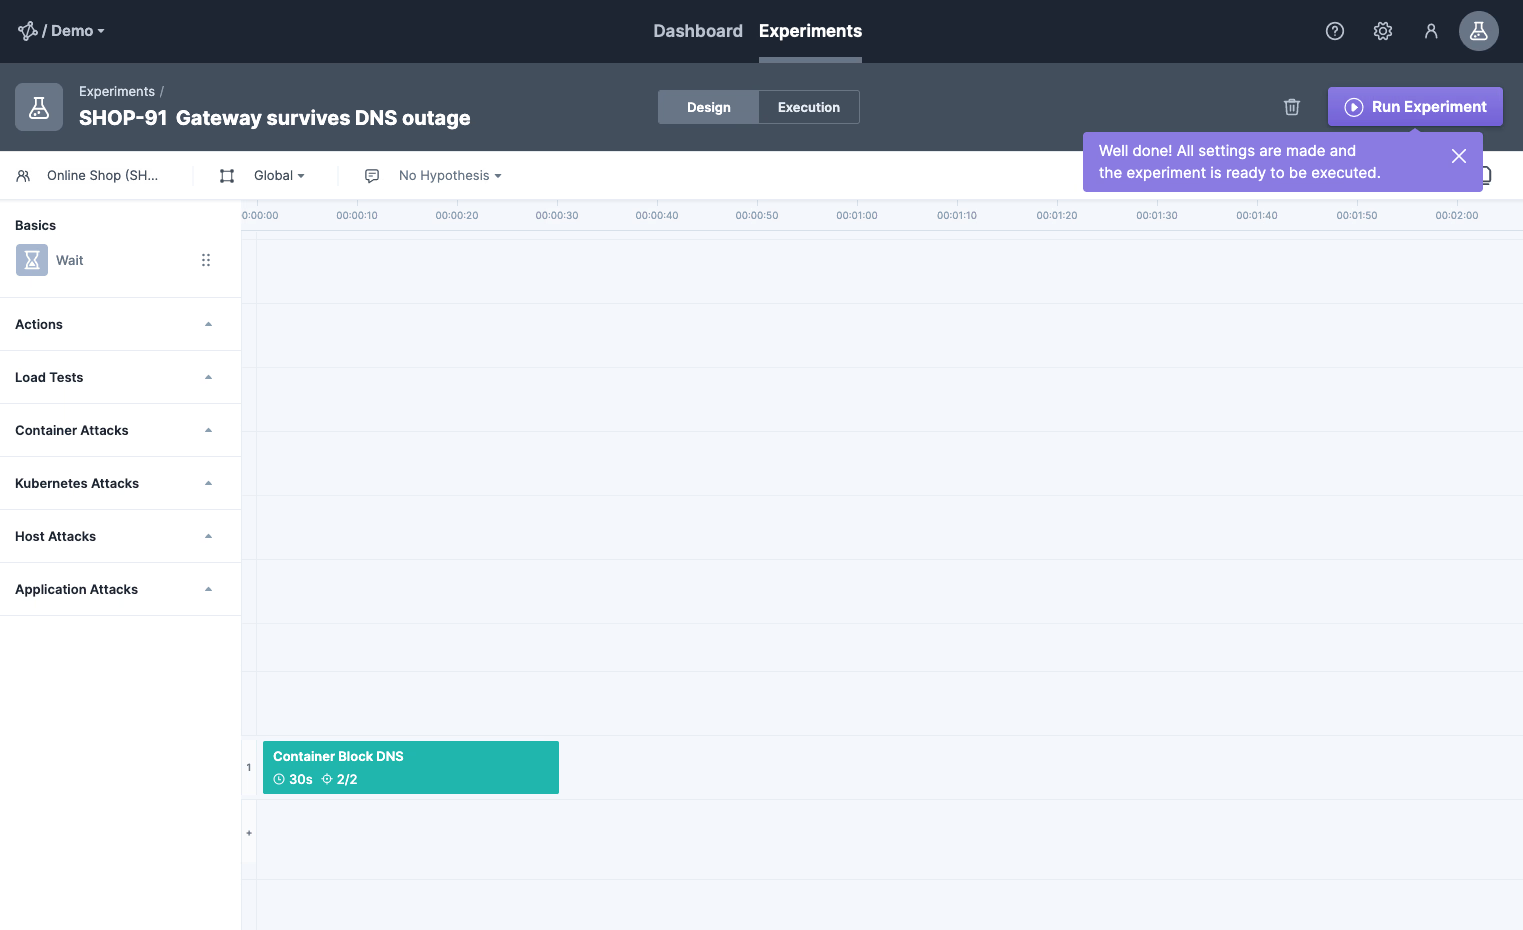
Step 2: The New Experiment Editor
So, now we land for the first time in our new experiment editor! It is pretty neat and allows us to add attacks, checks, or actions to the experiment via drag and drop. We can decide for ourselves whether we want to run multiple attacks one after the other or simultaneously. We make more use of it in step 4.
Step 3: Run the Experiment to check System
For now, we will run the experiment we have created and see how our application behaves.
This brings us to the new Steadybit execution window (left side of the screenshot), which provides many details about the system. The system looks stable now, and everything seems to be working. We will look closer at the system in step 5 to analyze erroneous behavior.
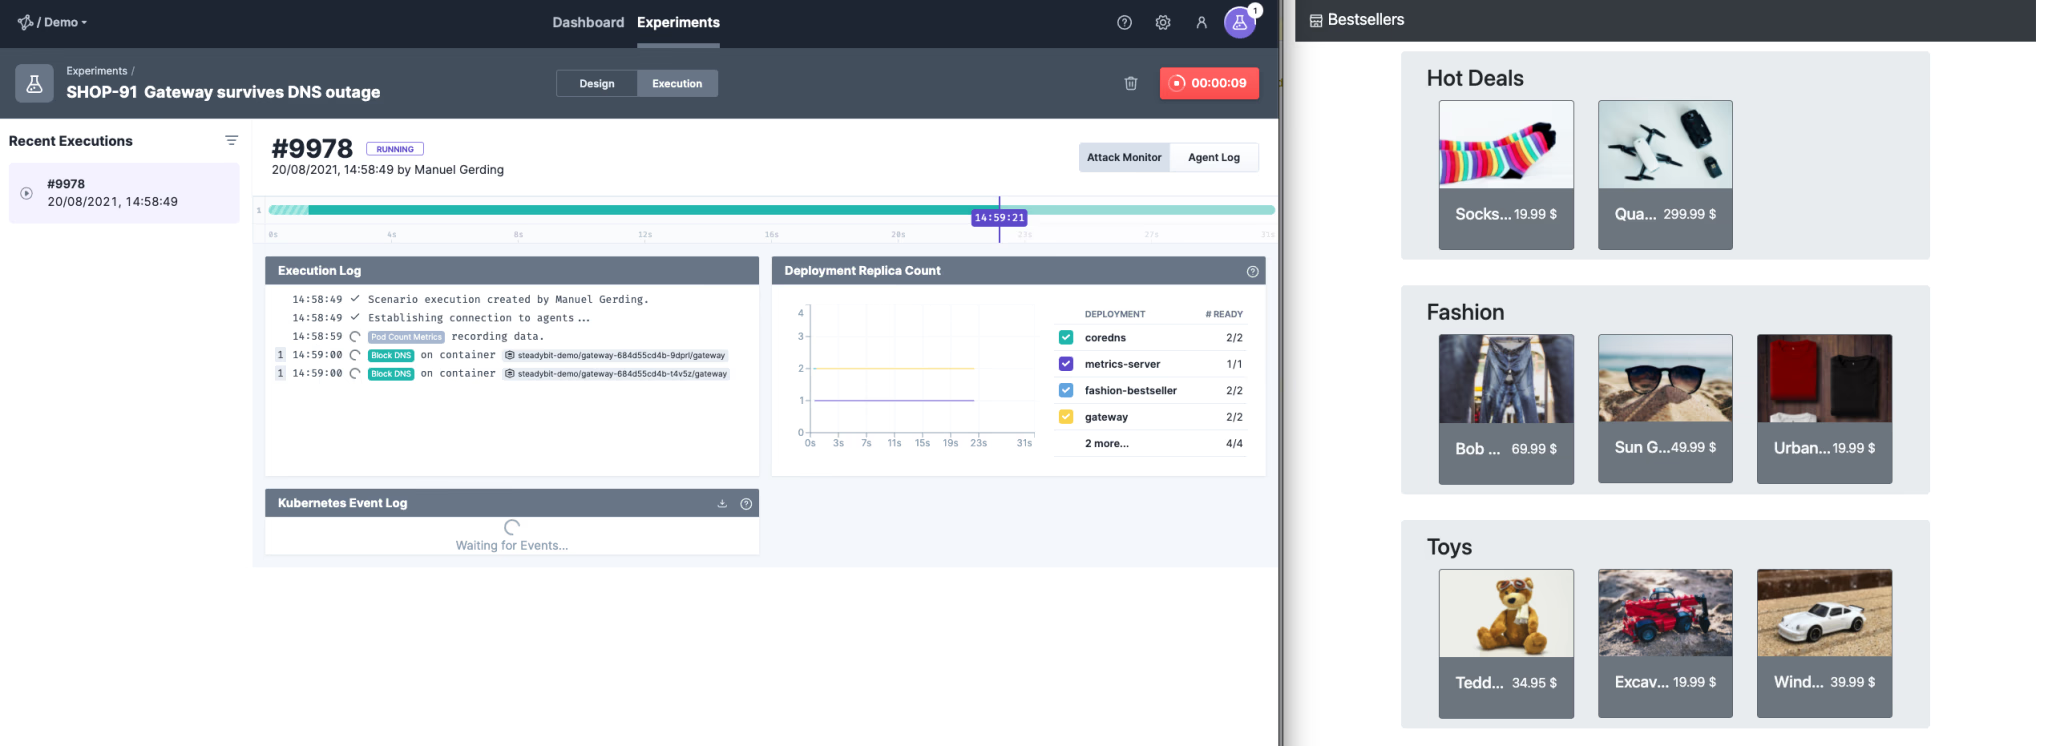
However, opening up the demo shop in parallel (right side) we get the same feeling: the shop is still working – we are safe!
But wait, are we? As you probably know: DNS records are cached. This way, a DNS failure is not so bad as long as the DNS cache is up to date. But what happens to the system when the DNS cache isn’t there yet?
Step 4: Levelling Up the Experiment
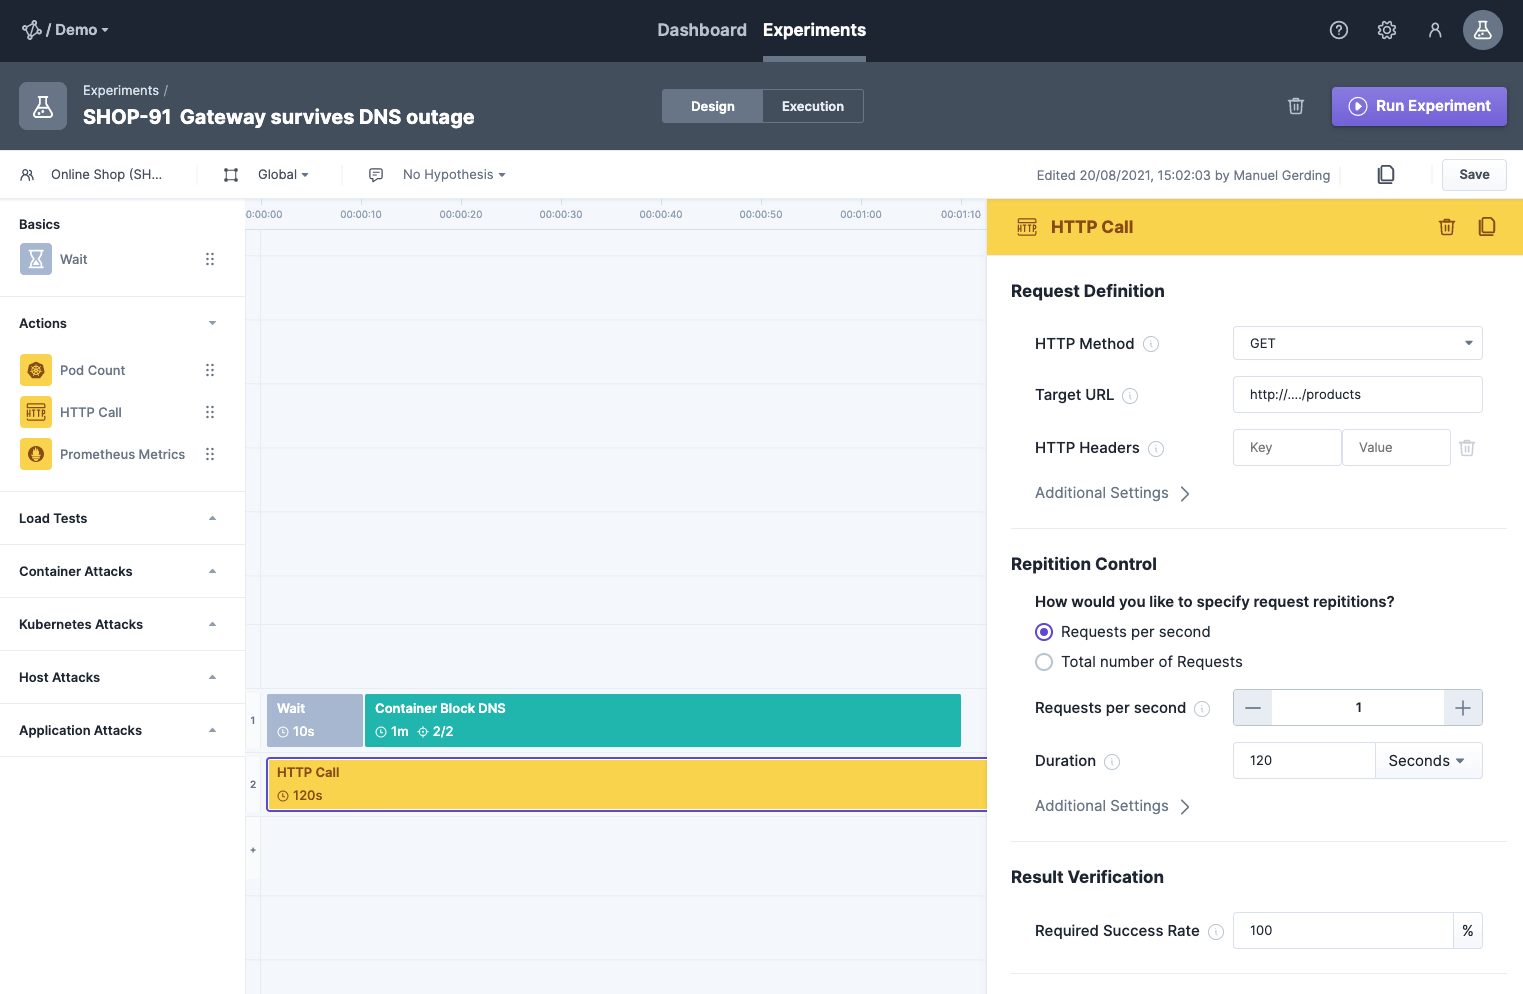
Let’s extend the scenario by adding more steps. First, we add a wait step of a few seconds before the “DNS failure” attack and a simultaneous HTTP call from the beginning. This will periodically request the HTTP endpoint of the online shop and ensure that the DNS entries are cached when the DNS failure is simulated.
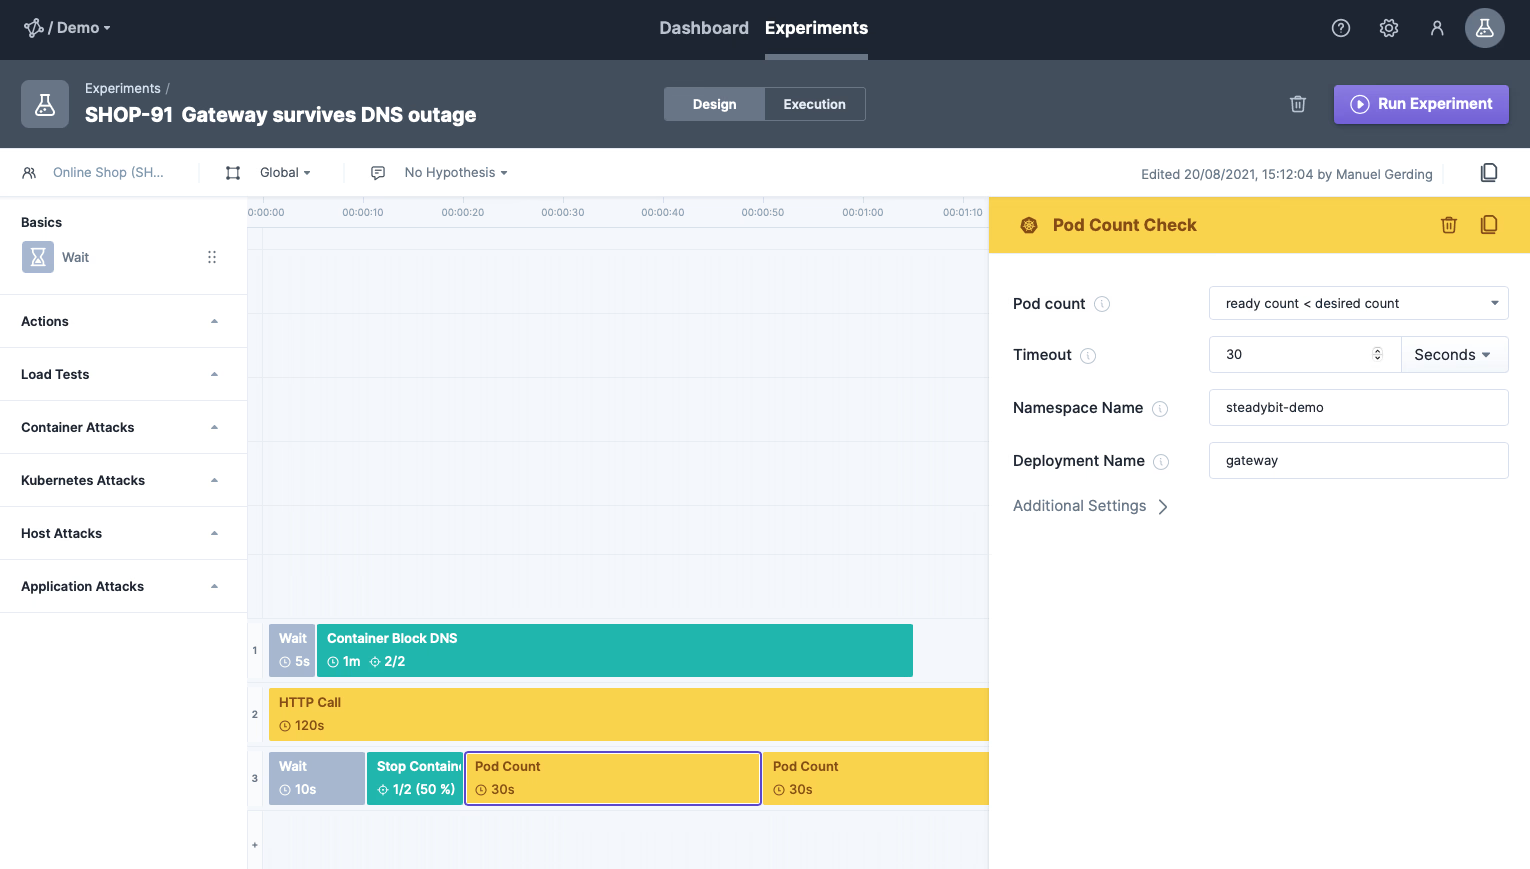
The next step is to crash one of the gateway containers (using a simple stop container attack), immediately restarted by Kubernetes. We can also check if the pod has been successfully marked as unhealthy and is ready again afterward by using the pod count checks (see lane 3).
All right, ready to go! Let’s check how our system behaves and keep our fingers crossed that the user won’t notice any downtime. We’ll rerun the experiment.
Step 5: Boom! A Weak Spot revealed!
Uh-oh…This doesn’t look so good. The experiment failed because the HTTP call received some erroneous responses. Let’s take a closer look and analyze what happened.
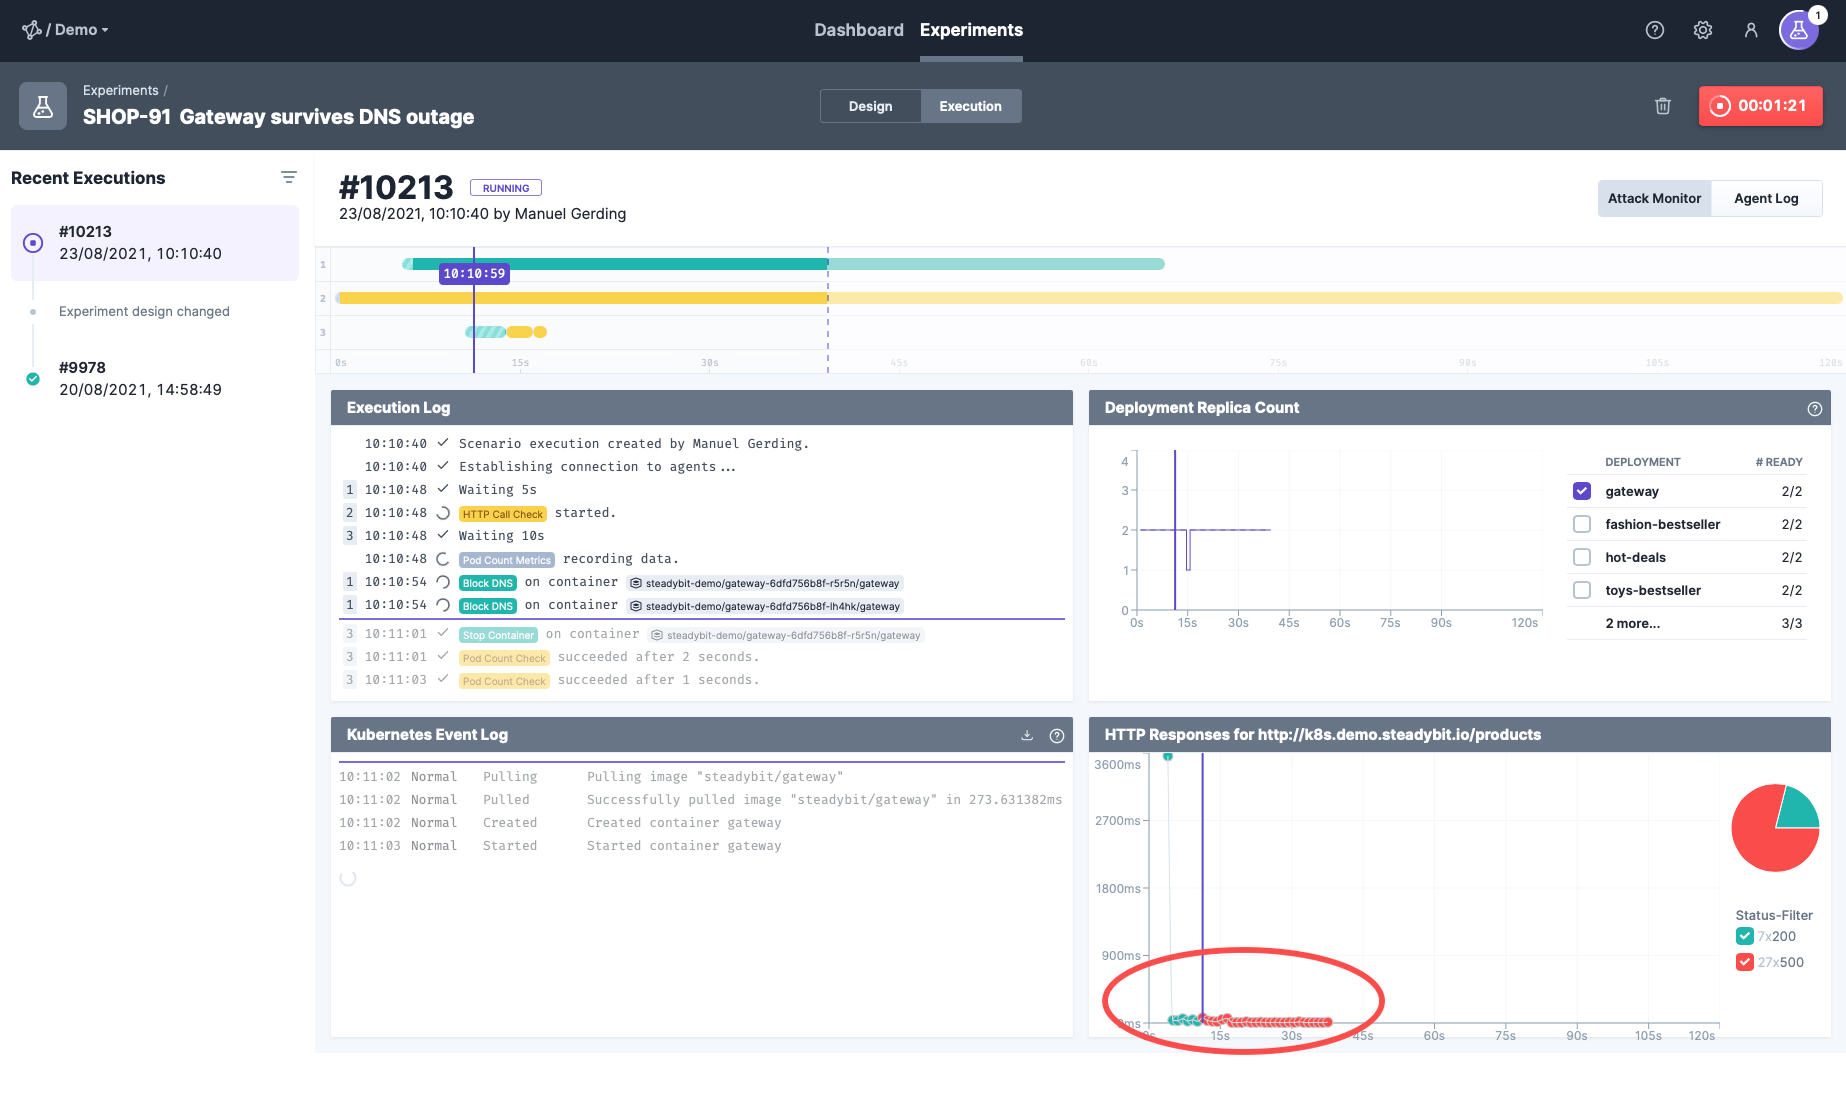
The execution view already shows all the necessary details to find out what happened here:
- The execution log shows which step is running, which was successful, and which failed. We can see that the HTTP call check was below the default threshold of 100% successful requests and thus failed.
- Checking the Deployment Replica Count, we can see that a pod was not ready for a few seconds. This is plausible since we terminated the underlying container simultaneously (compare the timing with the execution widget).
- We can also see Kubernetes behavior in the Kubernetes Event Log, which informs us of an unhealthy endpoint, a restart of the gateway container, and the Instana Event log proving that our monitoring works and detected an increase in the number of erroneous calls!
Putting the puzzle pieces together, we can conclude that the restarted container was immediately marked as ready again (as soon as the configured readiness probe was successful). Nevertheless, due to the DNS failure and the missing DNS cache, it could not reach any other microservices (Hot-Deals, Fashion-Bestseller, and Toys-Bestseller) via HTTP.
However, Kubernetes assumes it has two ready pods, which are both working fine, and it can schedule the HTTP requests to both. Thus, it sends the requests to the newly started container and has no idea it is not working correctly due to DNS cache errors.
We can even validate the hypothesis by re-running it a few times, as the routing of Kubernetes may also choose the healthy gateway pod to serve the request.
Step 6: Fixing the Weak Spot
Now that the weak spot has been exposed, we have several options to fix it. The simplest approach would be to extend the gateway’s health endpoint to check the availability of the endpoints of other microservices (Hot-Deals, Fashion-Bestseller, and Toys-Bestseller).
However, a better approach would be to rethink the shop’s architecture in terms of a self-contained system. Right now, the gateway has a very tight coupling to other microservices, making it difficult to get it working reliably. Applying known patterns of eventual consistency and caches may help to reduce the coupling.
Conclusion
So, bottom line: Setting up more complex experiments with Steadybit’s new experiment features is pretty straightforward. We could set up a complex experiment in a few minutes and use it to test our system for specific turbulent conditions. This way, we could uncover a weak spot and think about possible fixes. However, the Experiment Editor has many more features waiting for you. In the coming weeks, we will present some of them in blog posts covering, e.g., the integration of monitoring solutions like Instana, New Relic, Data Dog, and Prometheus.

Get started today
Full access to the Steadybit Chaos Engineering platform.
Available as SaaS and On-Premises!
or sign up with

Book a Demo
Let us guide you through a personalized demo to kick-start your Chaos Engineering efforts and build more reliable systems for your business!