Track Your Chaos Experiment Metrics in Steadybit Using Prometheus
If you run chaos experiments, you certainly want to see how these experiments play out in your monitoring tools – of course at the same time when you run the experiments. For this purpose steadybit has the possibility to connect various monitoring tools. These include Instana, New Relic, Datadog and Prometheus.
This is the first blog of my blog series about metrics integrations in steadybit.
In this blog post you learn how to set up the connection to Prometheus.
You usually have a system configured to see the health indicators of your system: Your monitoring solution. Steadybit can connect and integrate with it while executing experiments, checking for triggered alerts and health indicators.
Side note: In addition, you can use a simple HTTP Status Check when executing an experiment. Check our docs.
What is Prometheus?
Prometheus is an open-source systems monitoring and alerting toolkit.
Prometheus collects and stores its metrics as time series data, i.e. metrics information is stored with the timestamp at which it was recorded, alongside optional key-value pairs called labels.
Prometheus is able to manage alerts and triggers them in certain situations. With our integration we can react to these alerts and use them for automatic state checks in experiments. Read more about Prometheus alerts.
Configuration
In our steadybit platform goto to Settings/Monitoring Integrations.
There you have to enter the Prometheus base URL. That’s all we need to react to the alerts provided by Prometheus.

Experiments with monitoring / Prometheus
Once Prometheus has been configured, you can use the Prometheus Metric State Check in an experiment or just watch the Prometheus Alerts Event Log.
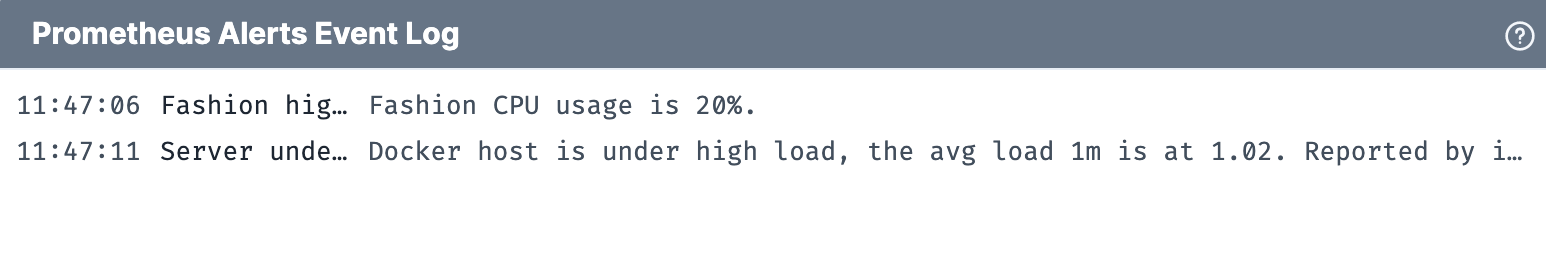
Prometheus Alerts Event Log
In the Prometheus Alerts Event Log you can see all alerts occurred during the experiment execution. You don’t have to configure anything on the experiment – when prometheus is configured in the platform settings, the alerts are automatically observed for each experiment.
Prometheus Metric State Check
With the Prometheus Metric State Check you can observe specific metrics in an experiment and specify a threshold, when the experiment should fail.
To do this, take the step Prometheus Metrics from the Actions and drag’n’drop it into the experiment where you want to check the metrics. Afterwards, you have to fill in the corresponding parameters like metric name and threshold in the Prometheus Metric configuration.

This is the same as a query in Prometheus itself like
_node_load1{instance="prometheus.demo.playground.xyz:9100"}

If you now run the experiment, you will see a graph that reflects the course of the metric at runtime. The experiment fails when the metric exceeds its configured threshold.


Conclusion
That’s it already! Track how all data streams converge and take advantage of this connection regarding security and control when running chaos experiments.
Want to learn more about it? Just book a demo; we are looking forward to it.
In the next blog post in this series, I will talk about New Relic.
How to See Metrics of Your Chaos Experiments in Steadybit With New Relic