How to See Metrics of Your Chaos Experiments in Steadybit With New Relic
If you run chaos experiments, you certainly want to see how these experiments play out in your monitoring tools; of course at the same time when you run your experiments. For this purpose, Steadybit can connect various monitoring tools. These include Instana, Prometheus, Datadog and New Relic. In this blog post, you learn how to set up the connection to New Relic.
This is the second part of my blog post series “Integrating Metrics in Steadybit”. You can find the first part of my blog post here.
If you run chaos experiments, you certainly want to see how these experiments play out in your monitoring tools; of course at the same time when you run your experiments. For this purpose, steadybit can connect various monitoring tools. These include Instana, Prometheus, Datadog and New Relic. In this blog post, you learn how to set up the connection to New Relic.
You usually have a system configured to see the health indicators of your system: Your monitoring solution. Steadybit can connect and integrate with it while executing experiments, checking for triggered events indicators.
In addition, you can use a simple HTTP Status Check when executing an experiment. Check our docs.
What is New Relic?
New Relic is an observability platform that enables engineers to develop perfected software. From monolith infrastructures to serverless, it instruments all elements of your environment. It uses innovative features to analyze, troubleshoot and optimize your entire software stack.
Configuration
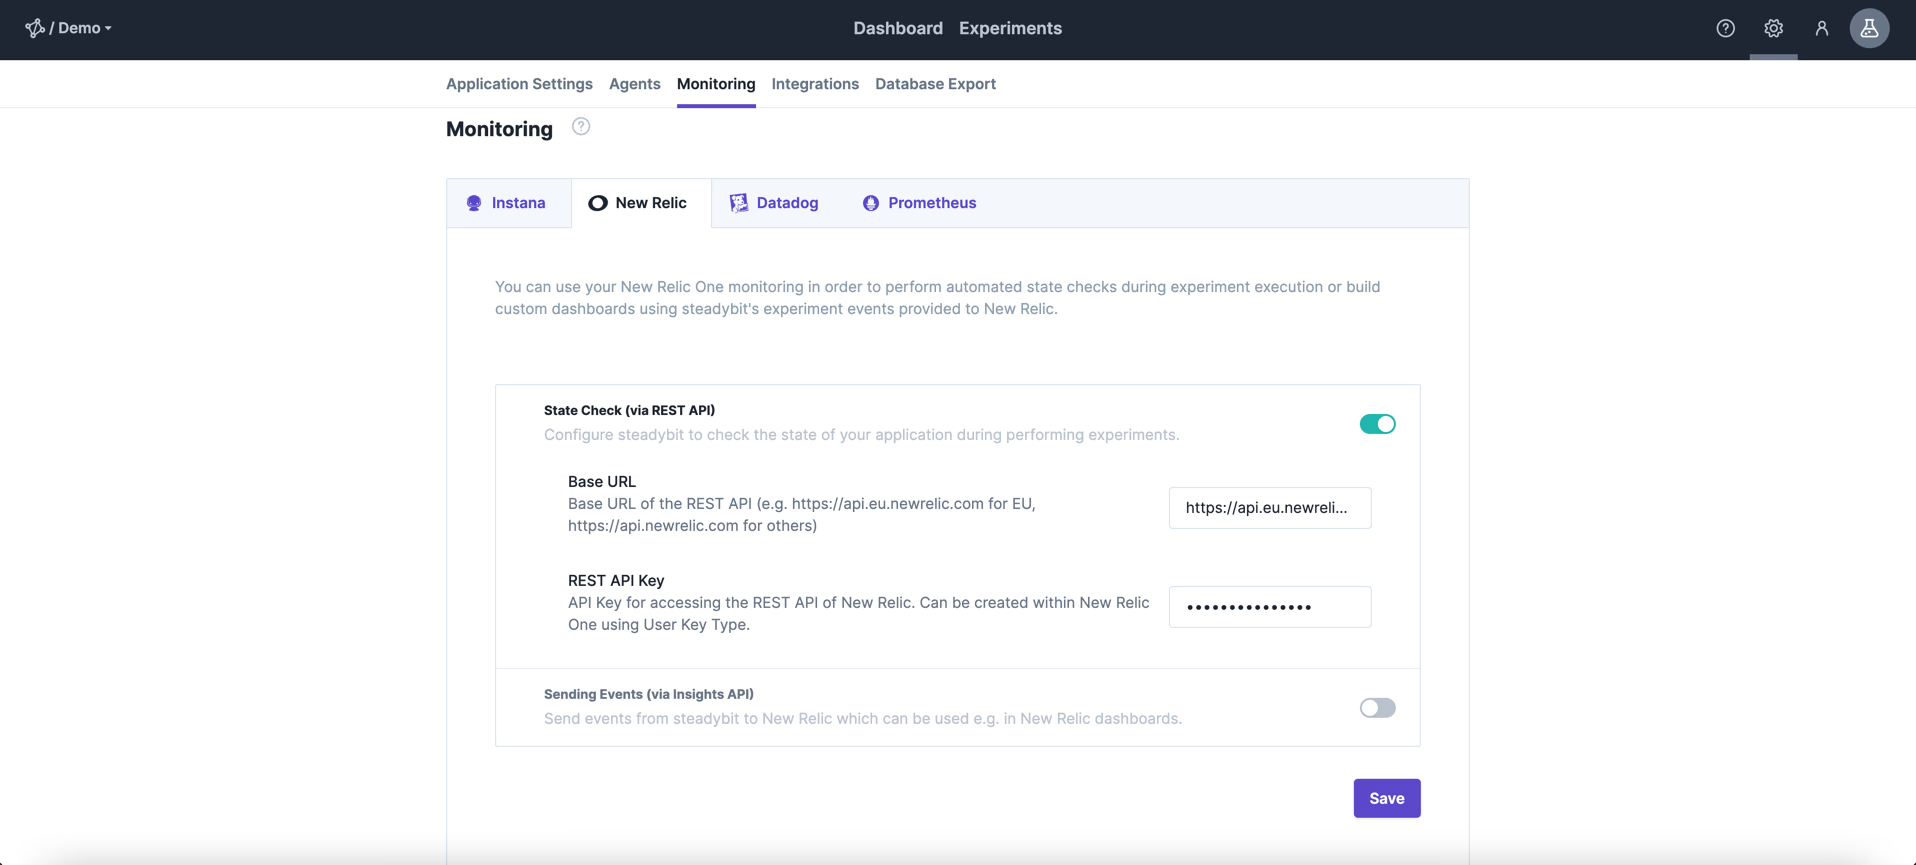
In our steadybit platform goto to Settings/Monitoring Integrations.
There are two general possibilities to integrate with New Relic:
- New Relic to steadybit: checking for specific events from New Relic in steadybit during experiment execution
- steadybit to New Relic: pushing steadybit events during experiment execution to New Relic
In this blog, we will have a look at “New Relic to steadybit”. So we have to configure “State Check (via REST API)”.
There you have the New Relic Base URL and the REST API Key that was previously created in New Relic. That’s all we need to react to the state checks in New Relic.
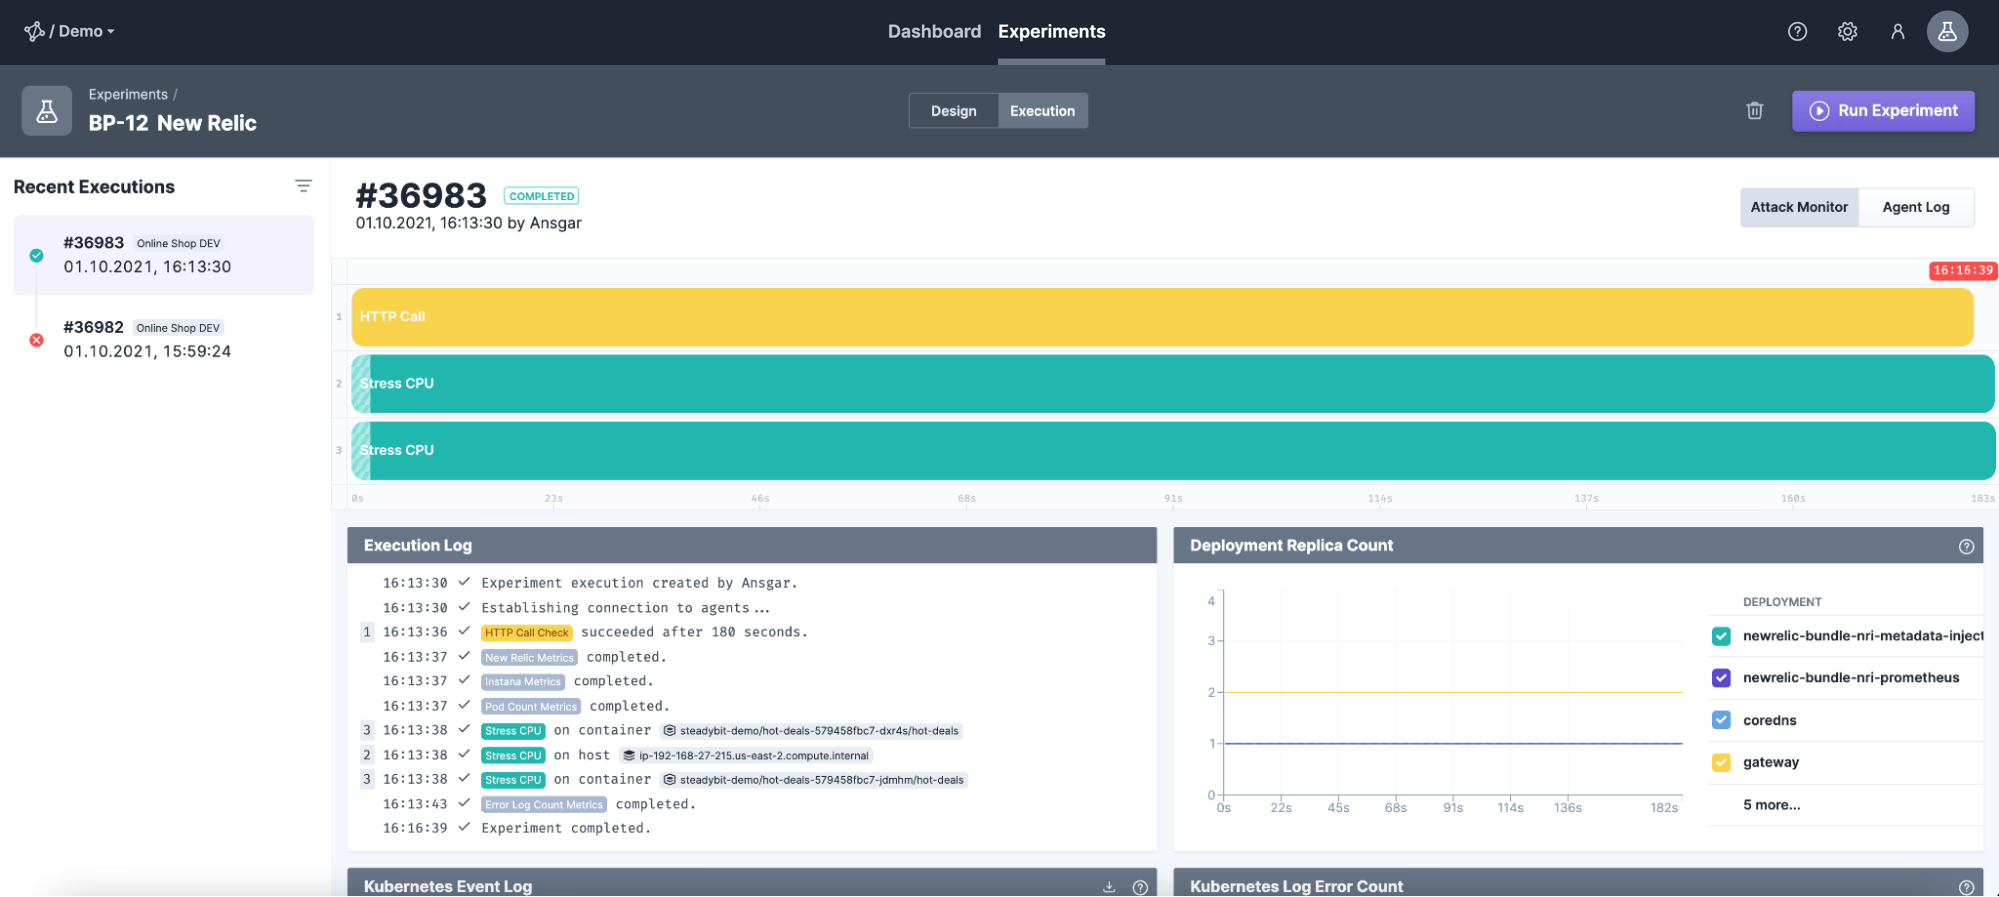
Experiments with monitoring / New Relic
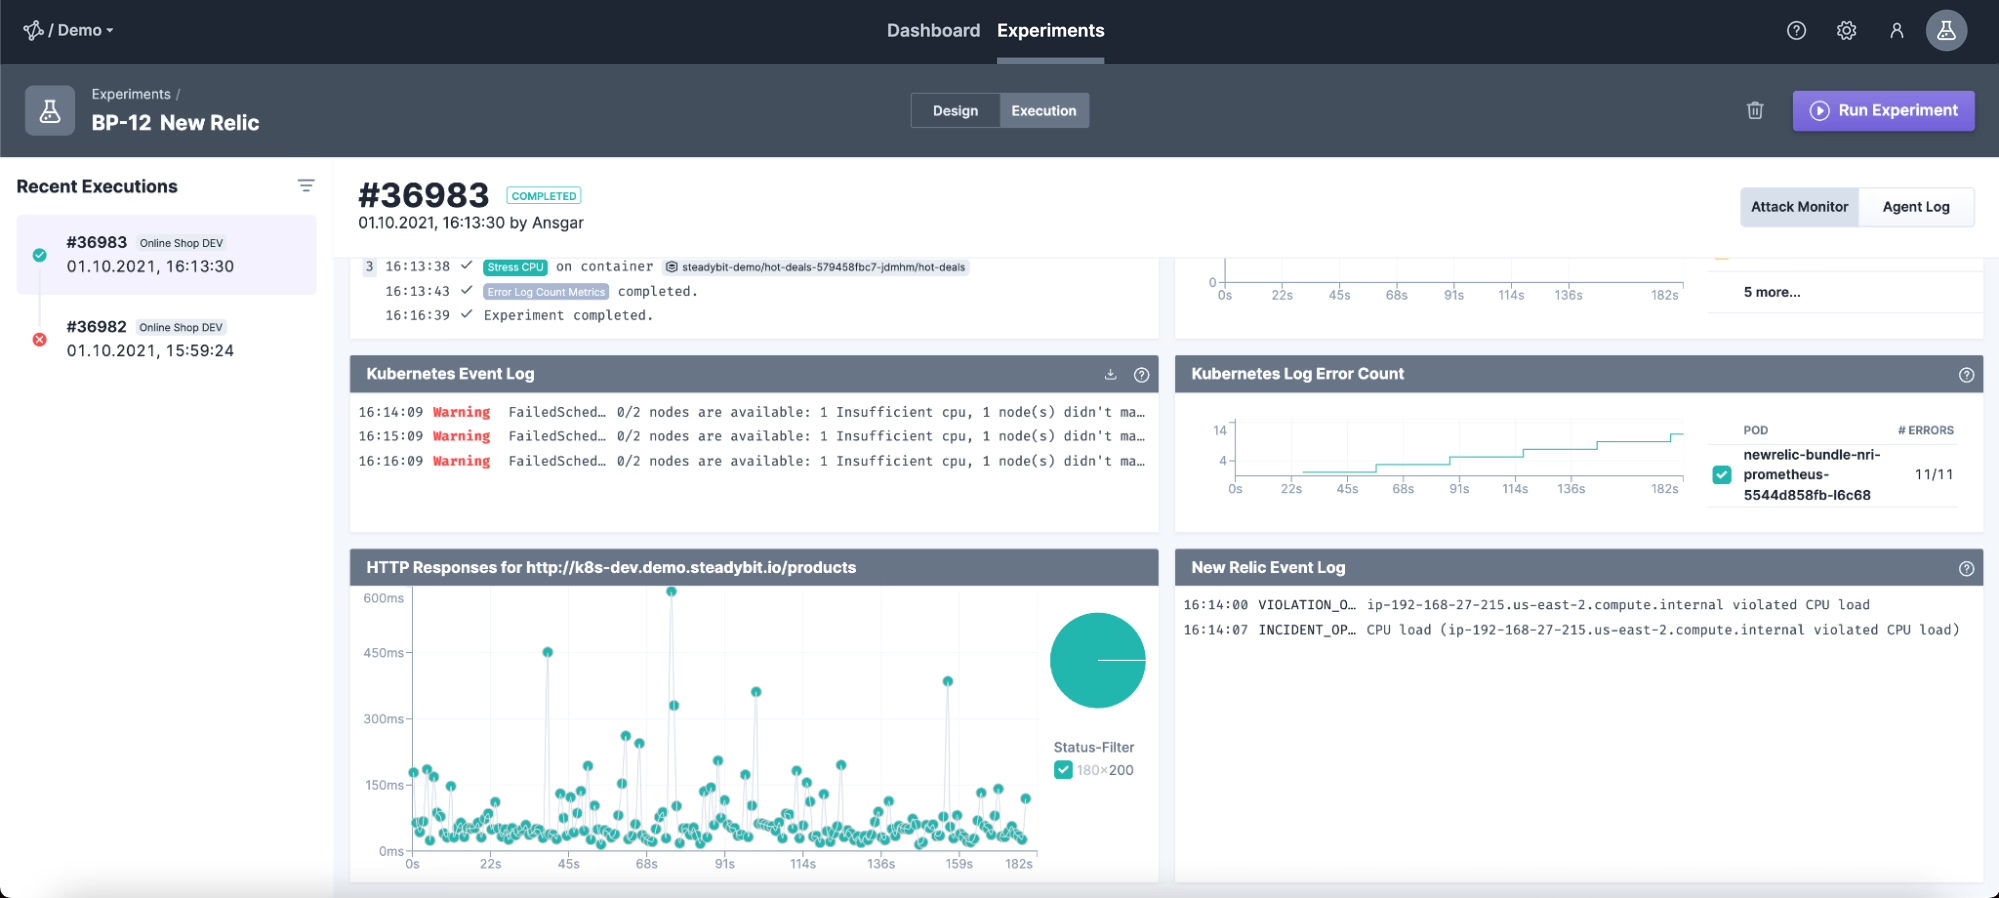
Once New Relic has been configured, you can watch the New Relic Event Log.
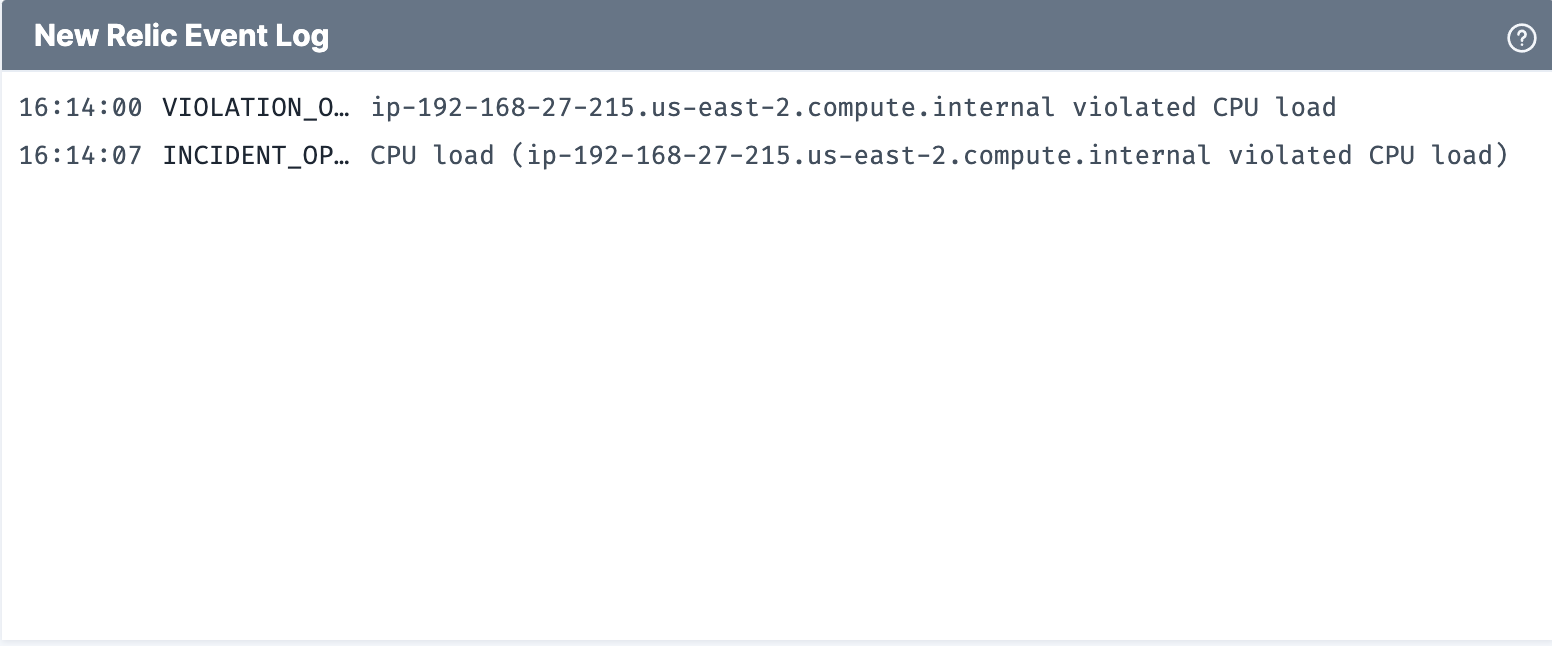
New Relic Event Log
In the New Relic Event Log, you can see all state checks during the experiment execution. You don’t have to configure anything on the experiment–when New Relic is configured in the platform settings, the events are automatically observed for each experiment.
Conclusion
That’s it already! Track how all data streams converge and take advantage of this connection in terms of security and control when running chaos experiments. Want to learn more about it? Just book a demo, we are looking forward to it.
In the next blog post in this series, I will talk about Instana.
See first blog of this series: See metrics of your chaos experiments in steadybit with Prometheus

Get started today
Full access to the Steadybit Chaos Engineering platform.
Available as SaaS and On-Premises!
or sign up with

Book a Demo
Let us guide you through a personalized demo to kick-start your Chaos Engineering efforts and build more reliable systems for your business!