
Blog

-
6 minutes
read
Improving your system's reliability can be challenging. Initially, you are looking at a large pile of infrastructure components from a dozen teams. They are all somehow connected, and every piece will fail eventually. While you can use Chaos Engineering to reveal the impact of each failure, you can't predict when a failure will happen. This makes it hard to know where to start and where to continue to keep getting the most value from Chaos Engineering. Also, once you have identified the first findings with Chaos Engineering, you need to check what other components suffer from similar issues.
That's why we released a new feature of Steadybit: the Landscape Explorer. The Landscape Explorer guides you on your Chaos Engineering journey to help you navigate through your system and allow you to make well-informed guesses when preparing upcoming Chaos Engineering experiments.
In this blog post, we first cover the underlying fundament of Steadybit that made this possible, followed by some hands-on examples of the Landscape explorer. This blog post concludes with a glimpse of the potential future steps.
Steadybit's Core: Target Discovery
One foundation when performing Chaos Engineering experiments with Steadybit is the automatic discovery of targets.
A target is an infrastructure component that you can attack in an experiment. So, it is the actual place where the fault, the behavior change, is injected. Responsible for both (discovery and fault injection) is an extension, a small piece of software that runs in your infrastructure. An extension not only discovers the actual target but also attributes that are key-value-pair metadata about the target and can also be used to enrich other targets. All these attributes describe each individual target so that you can be sure to attack the right one in your experiment.
Let's look at an example: The container extension can automatically discover containers, the host on which a container runs, and the used container image. The latter two are attributes added to the target container (container.host and container.image). Another extension, the AWS extension, is capable of discovering AWS EC2 hosts as targets and their related attributes like the AWS account (aws.account), region (aws.region), and zone (aws.zone). However, not only is the host running in the AWS context, but also the container running on that host. That's why the AWS extension is enriching these to the container target. The Kubernetes extension performs another beneficial enrichment for containers running in a Kubernetes cluster. The extension enriches the containers with attributes like k8s.deployment, k8s.namespace, and k8s.cluster-name.
The following example shows a discovered container target and some attributes.
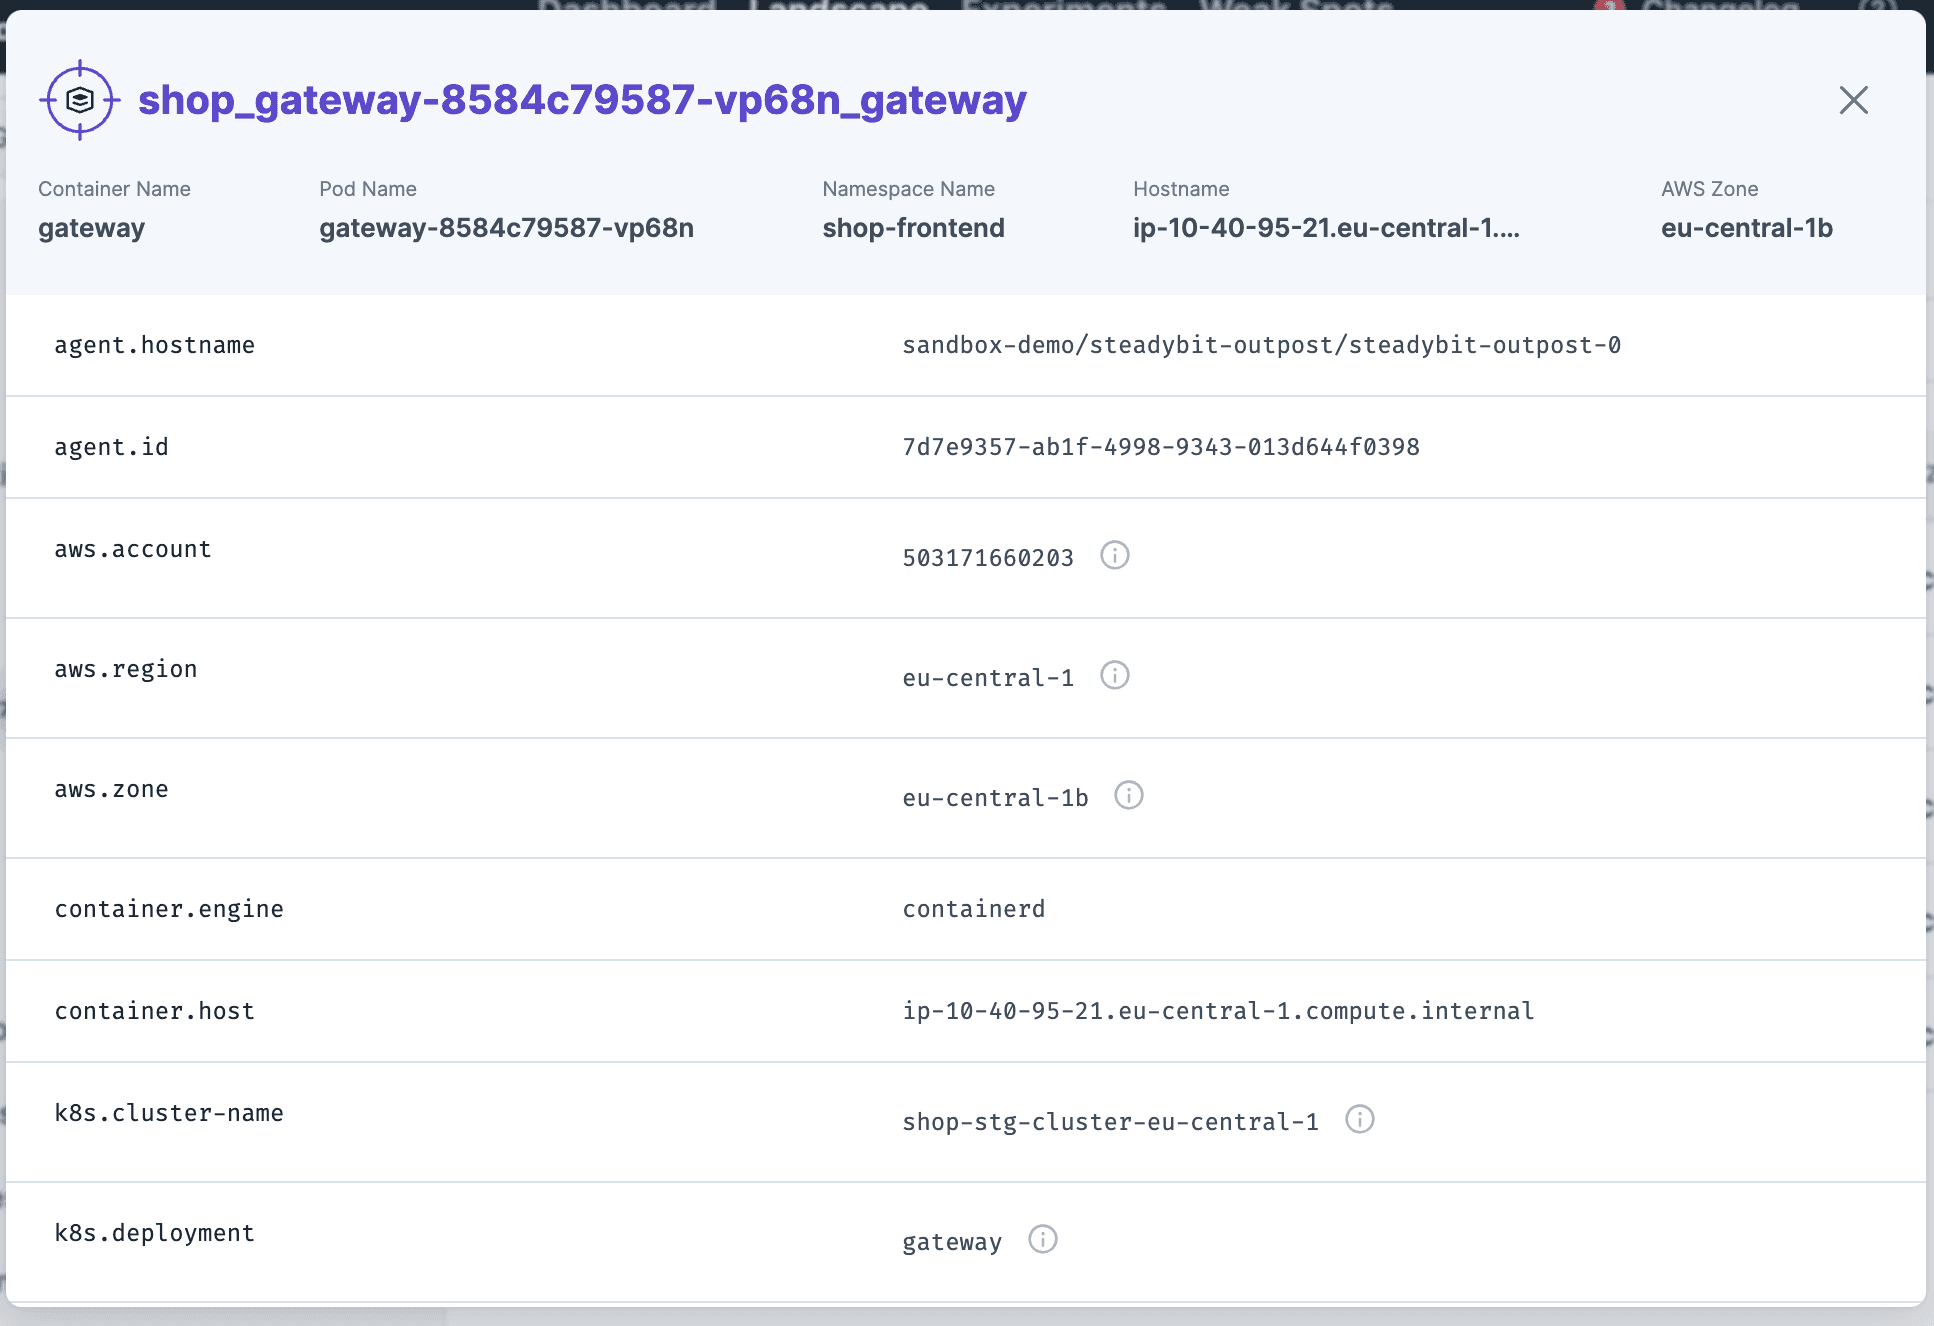
You can use this discovery information now in an experiment.
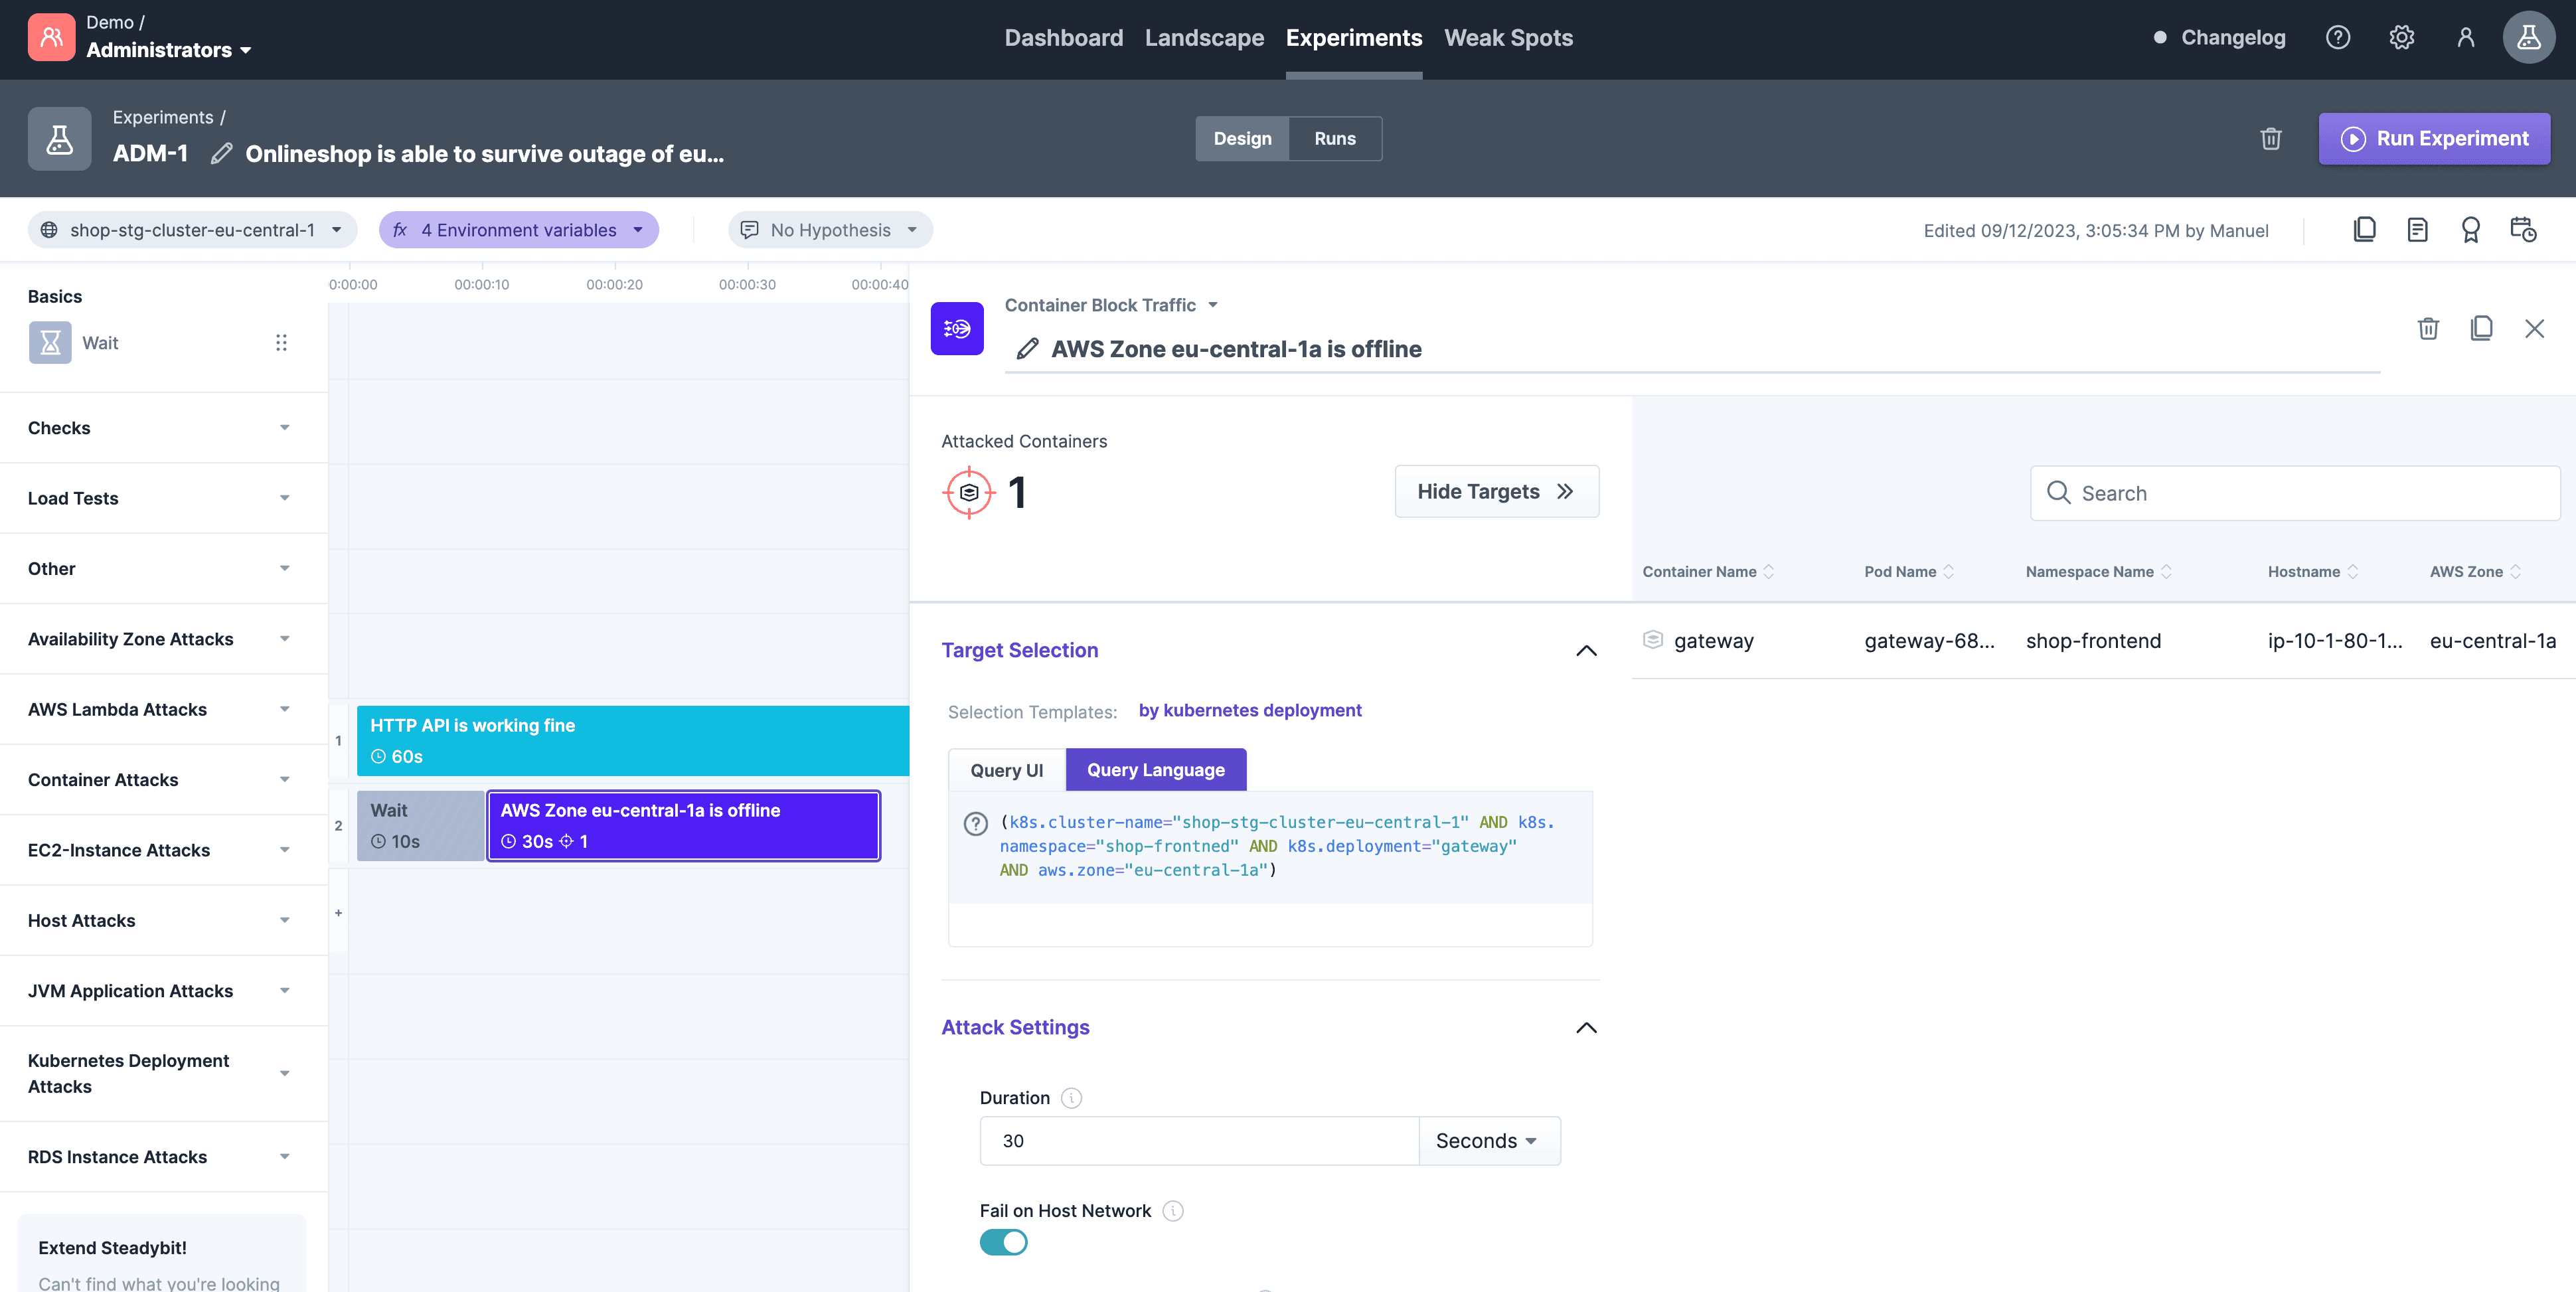
Let's say you want to limit the network bandwidth for a container in a specific AWS Availability Zone. By using Steadybit's query language, you can easily do so by filtering down to the exact target instance (e.g. k8s.cluster-name='dev-demo' AND k8s.namespace='shop' AND k8s.deployment='gateway' AND aws.zone='eu-central-1b').
Consequently, this also allows Steadybit to validate targets before running the experiment to avoid the trial-and-error of code-based Chaos Engineering approaches.
The Landscape Explorer
Based on the target discovery, we released a new feature: Landscape Explorer. By default, a click on 'Landscape' brings you to a Kubernetes Cluster map that arranges every discovered Kubernetes target and shows the corresponding namespace, deployment, and cluster.
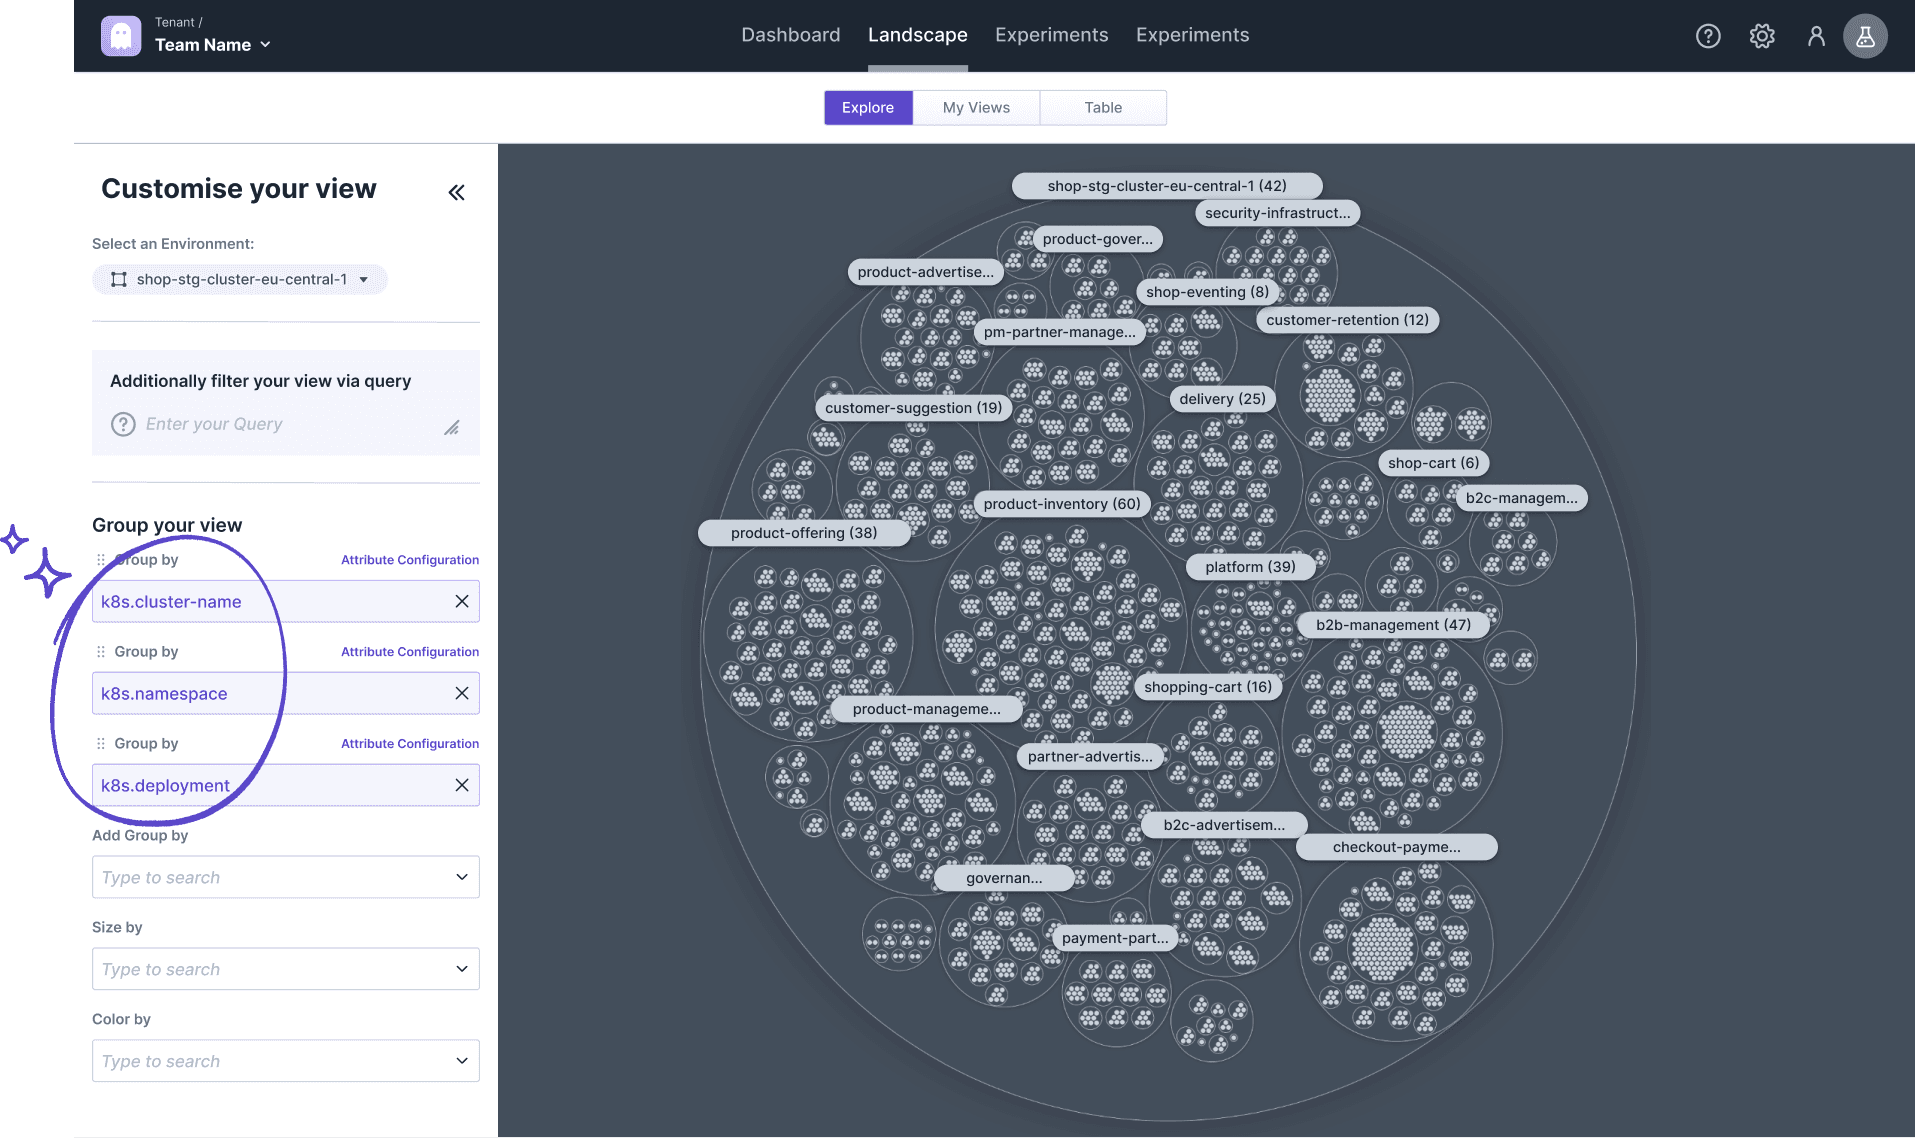
With that view, you already get a sense of how your cluster looks like - much better than a long table provided by other tools.
In addition, you can fully customize the view using one of the following capabilities:
Filter your targets to exclude them from the visualization,
Group your targets by attribute values to have them next to each other (even into several subgroups),
Size by attribute to highlight multiple values discovered for one target,
Color by attribute values to visualize the differences between your target's attributes.
Let's look at examples of how to use these features to guide the next Chaos Engineering experiments.
What Deployments Run Across Multiple Availability Zones?
Based on the Kubernetes map, we can easily add a further dimension to identify which deployments run across multiple AWS availability zones and which only run in one zone. For that, we can, e.g., color the components by aws.zone and check which deployment has only one color assigned and thus is running in one zone.
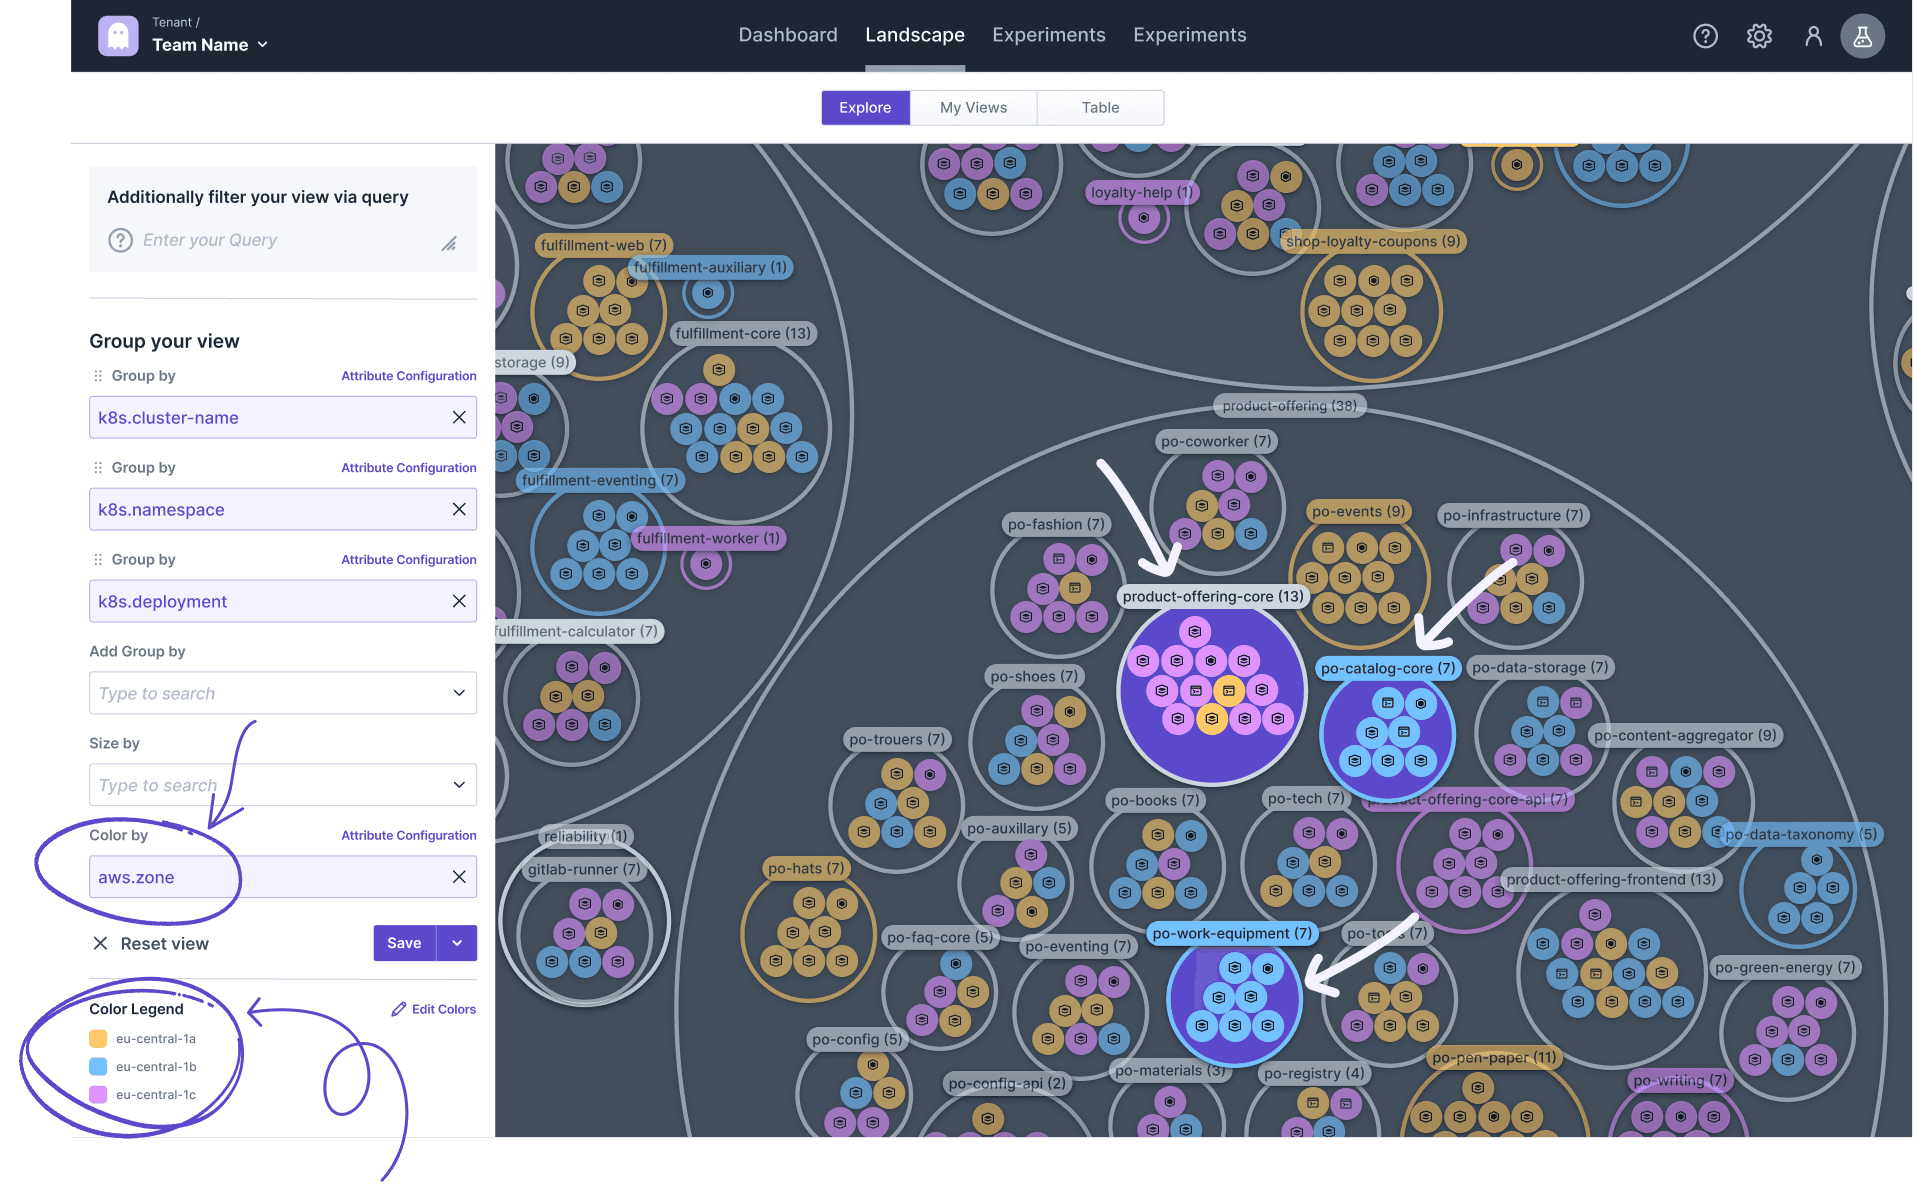
Looking at the product-offering-namespace we already have many deployments running across multiple zones (e.g. product-offering-core), but a few still run in just one zone (e.g., po-work-equipment and po-catalog-core).
Let's continue to drill down the Explorer to identify where to run the next Chaos Engineering experiments.
What Infrastructure Components Provide the Most Endpoints?
The need for the availability of a microservice usually correlates with the amount of API endpoints, load, and business criticality. Let's focus on the first one to check for significant infrastructure components. Therefore, we can use the discovered Spring MVC mappings (via spring.mvc-mapping) to size the targets by the number of endpoints.
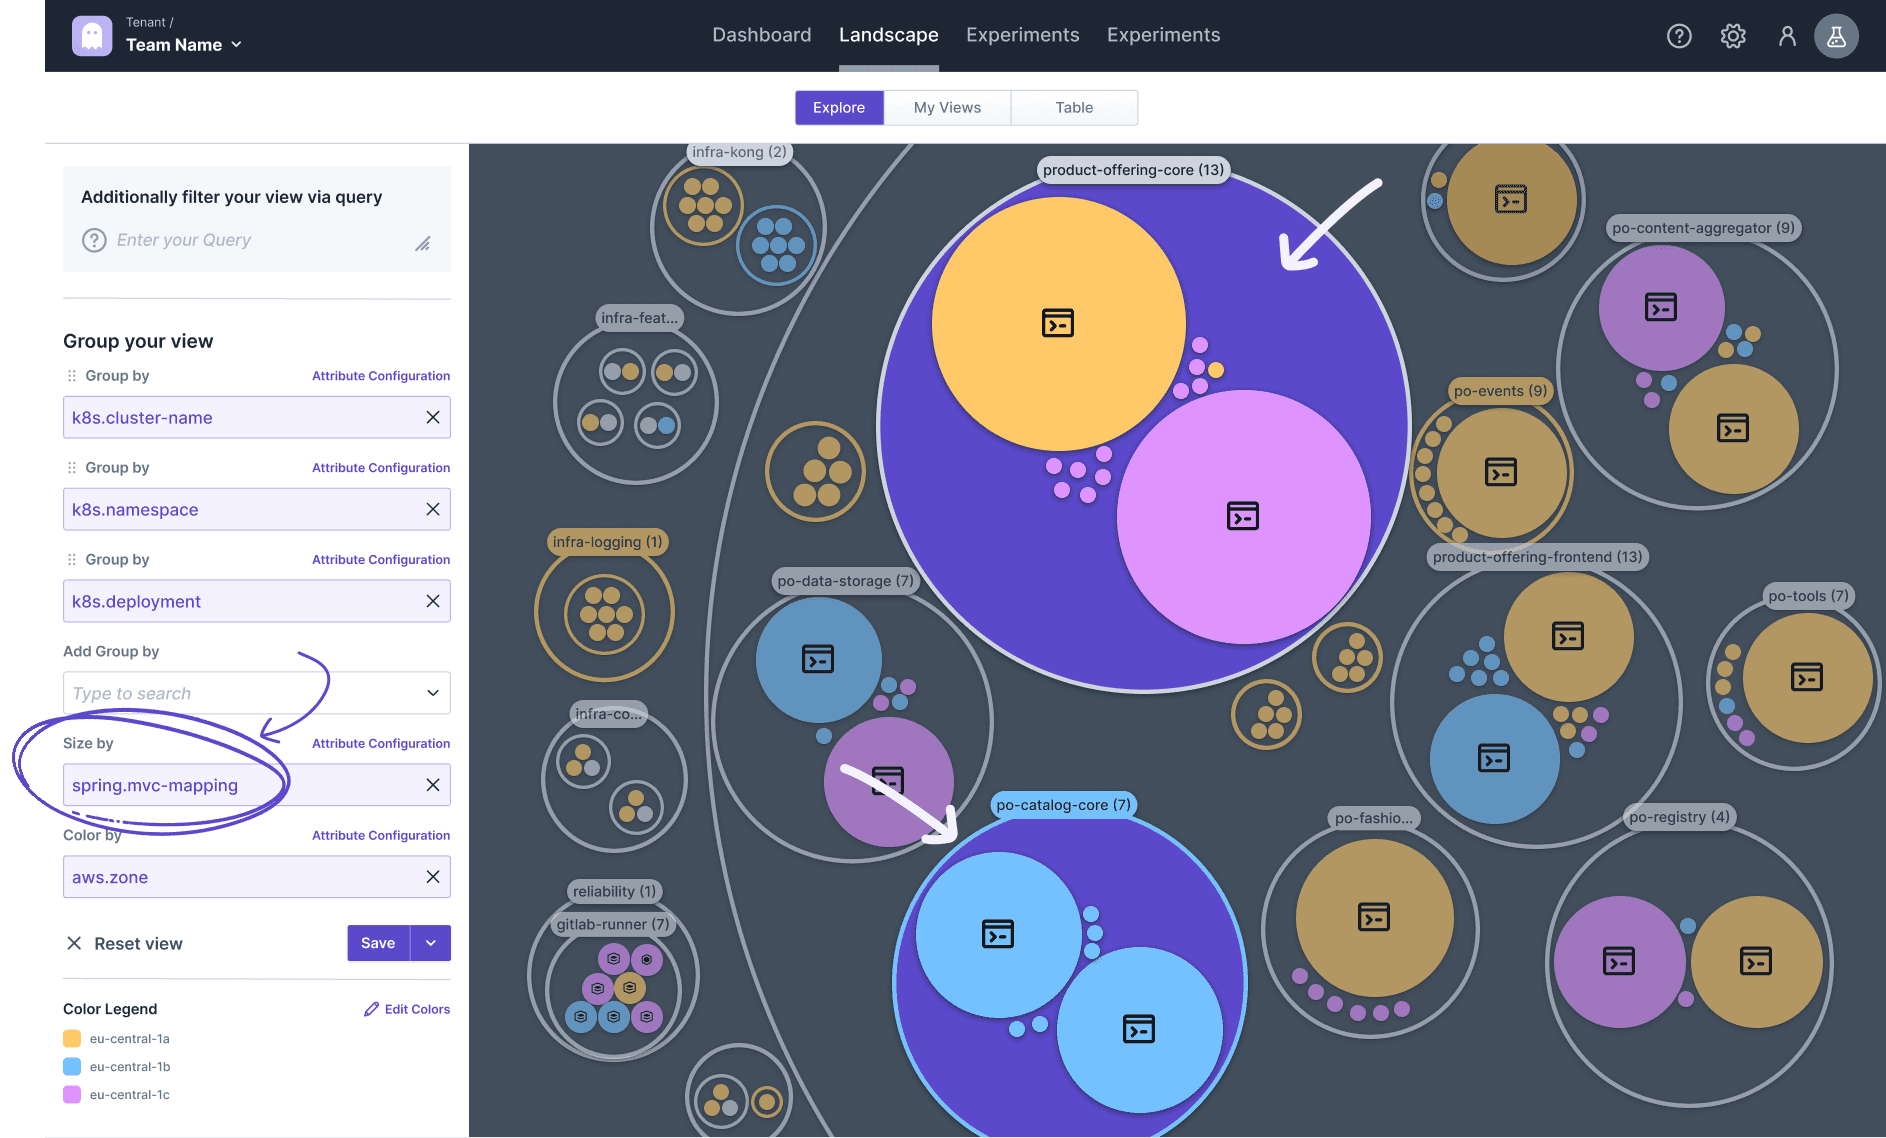
This exploration shifts the picture to a few infrastructure components being more relevant and thus their need for high availability and Chaos Engineering. For instance, looking at the product-offering-namespace, the product-offering-core has the most endpoints (and is also running in multiple zones), whereas, e.g., po-catalog-core has fewer endpoints but is also running in just one zone. However, we should continue with the drill-down before driving conclusions.
Which Infrastructure Components are Business Critical?
As mentioned, business criticality is also a good indicator for guiding your Chaos Engineering and getting the most value back since downtime of business-critical components matters the most. Luckily, your organization is describing the criticality of each component via a label (service-tier) that is automatically discovered by Steadybit as well. Components of service-tier 1 are the most critical ones and should run across multiple availability zones, so we are explicitly searching for those by applying an additional filter.
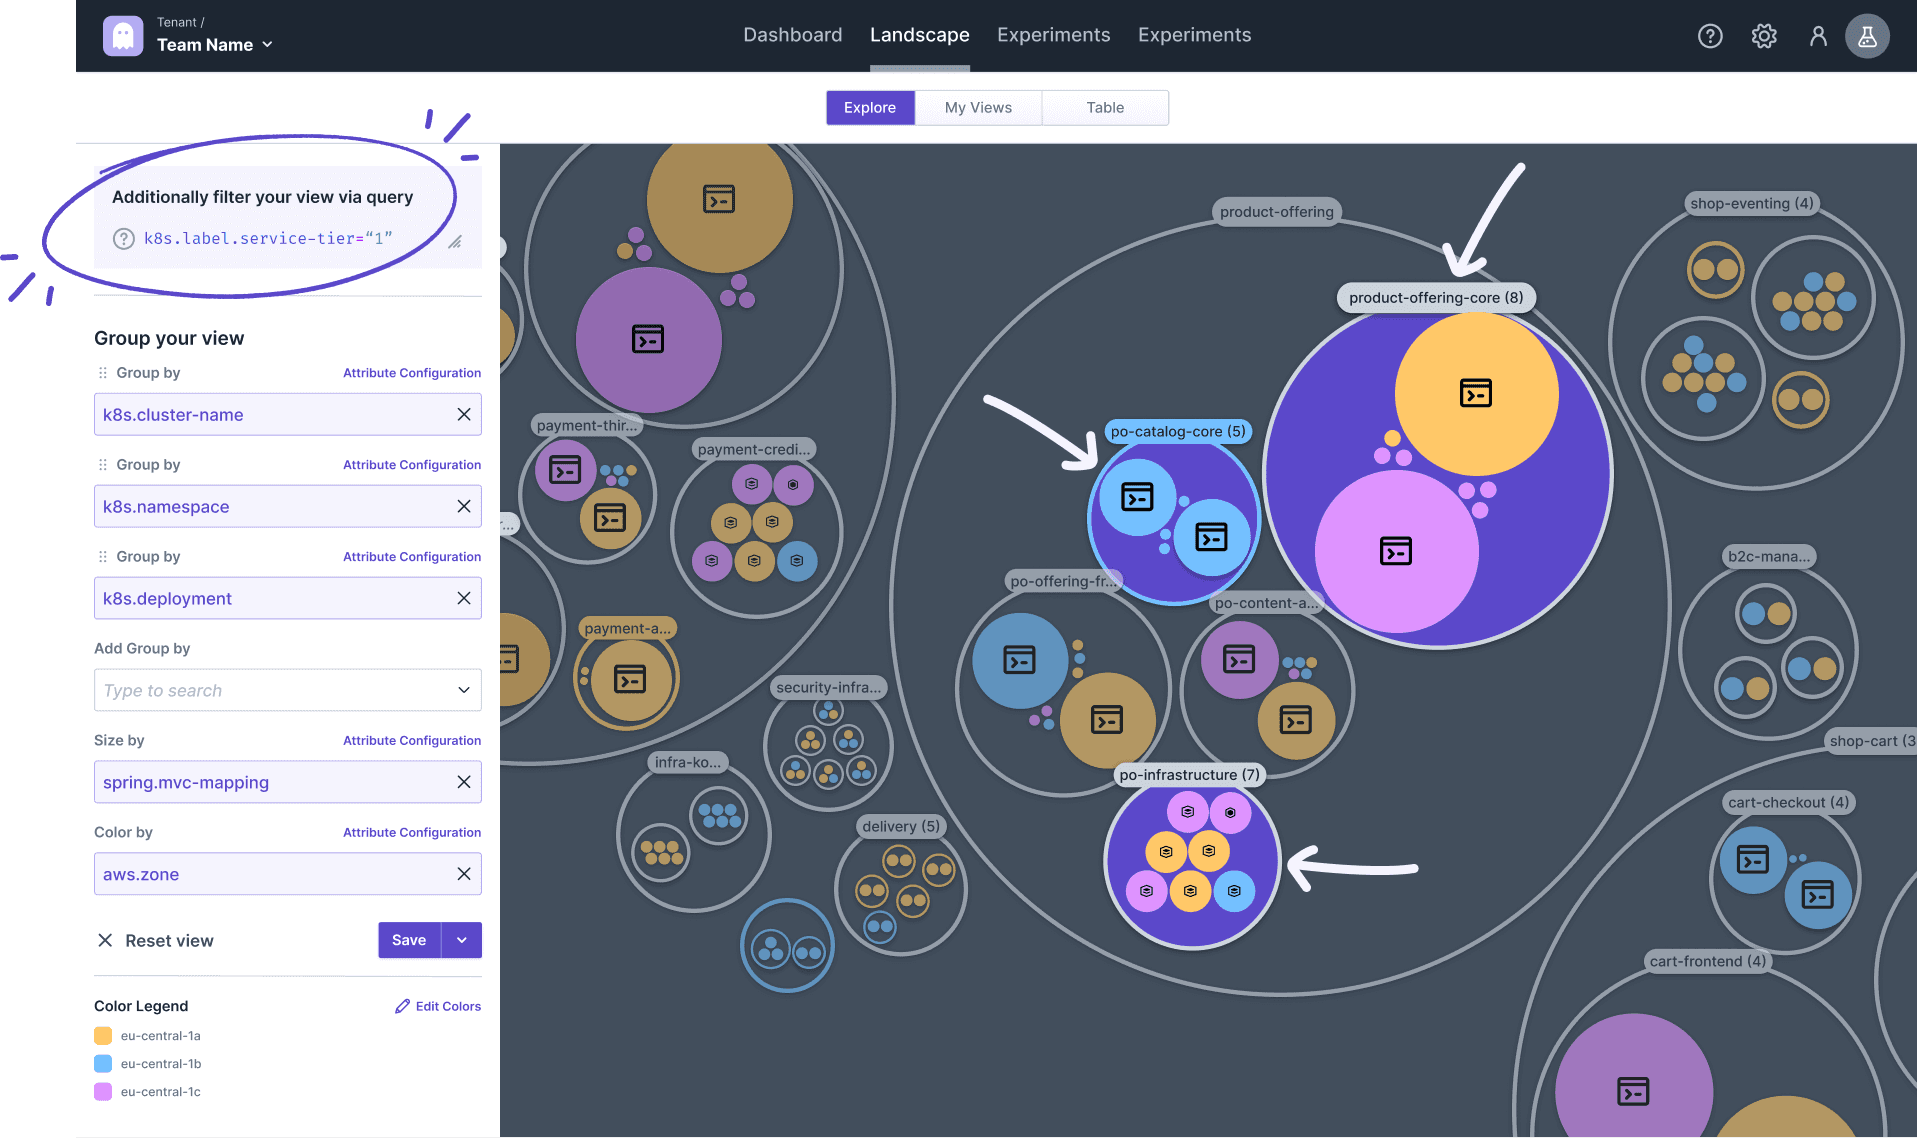
As visible above, most business-critical components within product-offering-namespace match the expectation to run in at least two availability zones (e.g., product-offering-core, and po-infrastructure). Those are perfect candidates to run a Chaos Engineering experiment to verify that the failover works successfully (see recipe Verify Smooth Operation During an AWS Zone Outage in our Reliability Hub). You can copy the query identifying the targets directly from the Explorer's sidebar.
However, some deployments (e.g., po-catalog-core) only run in one Availability Zone. We should immediately address this reliability issue without verifying it via a Chaos Engineering experiment (as we can already tell it would fail).
Further Exploration Examples
The drill-downs showed you some possibilities to start your Chaos Engineering journey.
You can easily think about further explorations like:
Which components still need to be migrated to the new container runtime? Based on the discovered attribute
container.runtime,Which team is responsible for which components? Based on an organization-specific label (e.g.,
label.domain, orlabel.owner),Which components aren't deployed using Helm? Based on the discovered attribute
kubernetes.io/managed-by,Which components are deployed by an outdated helm version and thus vulnerable to a discovered issue? Based on the discovered attribute
kubernetes.io/managed-by-version,Who isn't using an official AWS Container image? Based on the discovered attribute
container.image.repository
Extend Steadybit's Discovery Data to Support More Exploration
In this blog post, we used attributes discovered by extensions shipped with and maintained by Steadybit. However, you can extend Steadybit by writing your own extension to discover more attributes. You only need to implement an HTTP API, which makes enriching discovered targets easy. For instance, you could add the number of incidents per infrastructure component or add used technologies from your infrastructure-as-code repository to ease Chaos Engineering in your organization.
Outlook
The current feature set of the Landscape Explorer is just the start. Based on customer feedback, we explore options to add more data to the explorer, like configured teams, environments, or targets uncovered by experiments. We are also considering integrating our existing Weakspots (see Weakspot docs) into the Explorer. They have already provided you in the past with helpful insights to inform your Chaos Engineering journey, like missing readiness probes or not properly distributed Kubernetes deployments. When integrating them into the Landscape Explorer, we also make them open-source, allowing you to contribute weakspots - like you can contribute target discovery or Chaos Engineering attacks today.
Disclaimer: Images in this blog post show the Steadybit product and its features but are digitally altered to protect sensitive data.