See metrics of your chaos experiments in Steadybit with Instana
If you run chaos experiments, you certainly want to see how these experiments play out in your monitoring tools – even more so when you run experiments.
For this purpose, Steadybit has the possibility to connect various monitoring tools like New Relic, Datadog, Prometheus and Instana.
This is the third part of my blog post series “Integrating Metrics in Steadybit”. You can find the first part here and the second part here.
In this blog post you will learn how to set up the connection to Instana.
You usually have a system configured to see the health indicators of your system: Your monitoring solution. Steadybit can connect and integrate with it while executing experiments, checking for triggered events indicators.
Side note: In addition, you can use a simple HTTP Status Check when executing an experiment. Check our docs.
What is Instana?
Instana is a fully automated Application Performance Management (APM) solution designed specifically for the challenges of managing microservice and cloud-native applications.
Instana detects three major types of events to help you manage the Quality of Service of your applications:
- Issues
- Incidents
- Changes
With our Instana integration, we track changes in the system via the API provided by Instana and log them within the execution of an experiment. Changes noticed by Instana do not lead to an abort, since it may be intentional to start or shut down instances. Also check the Instana documentation about Events & Incidents.
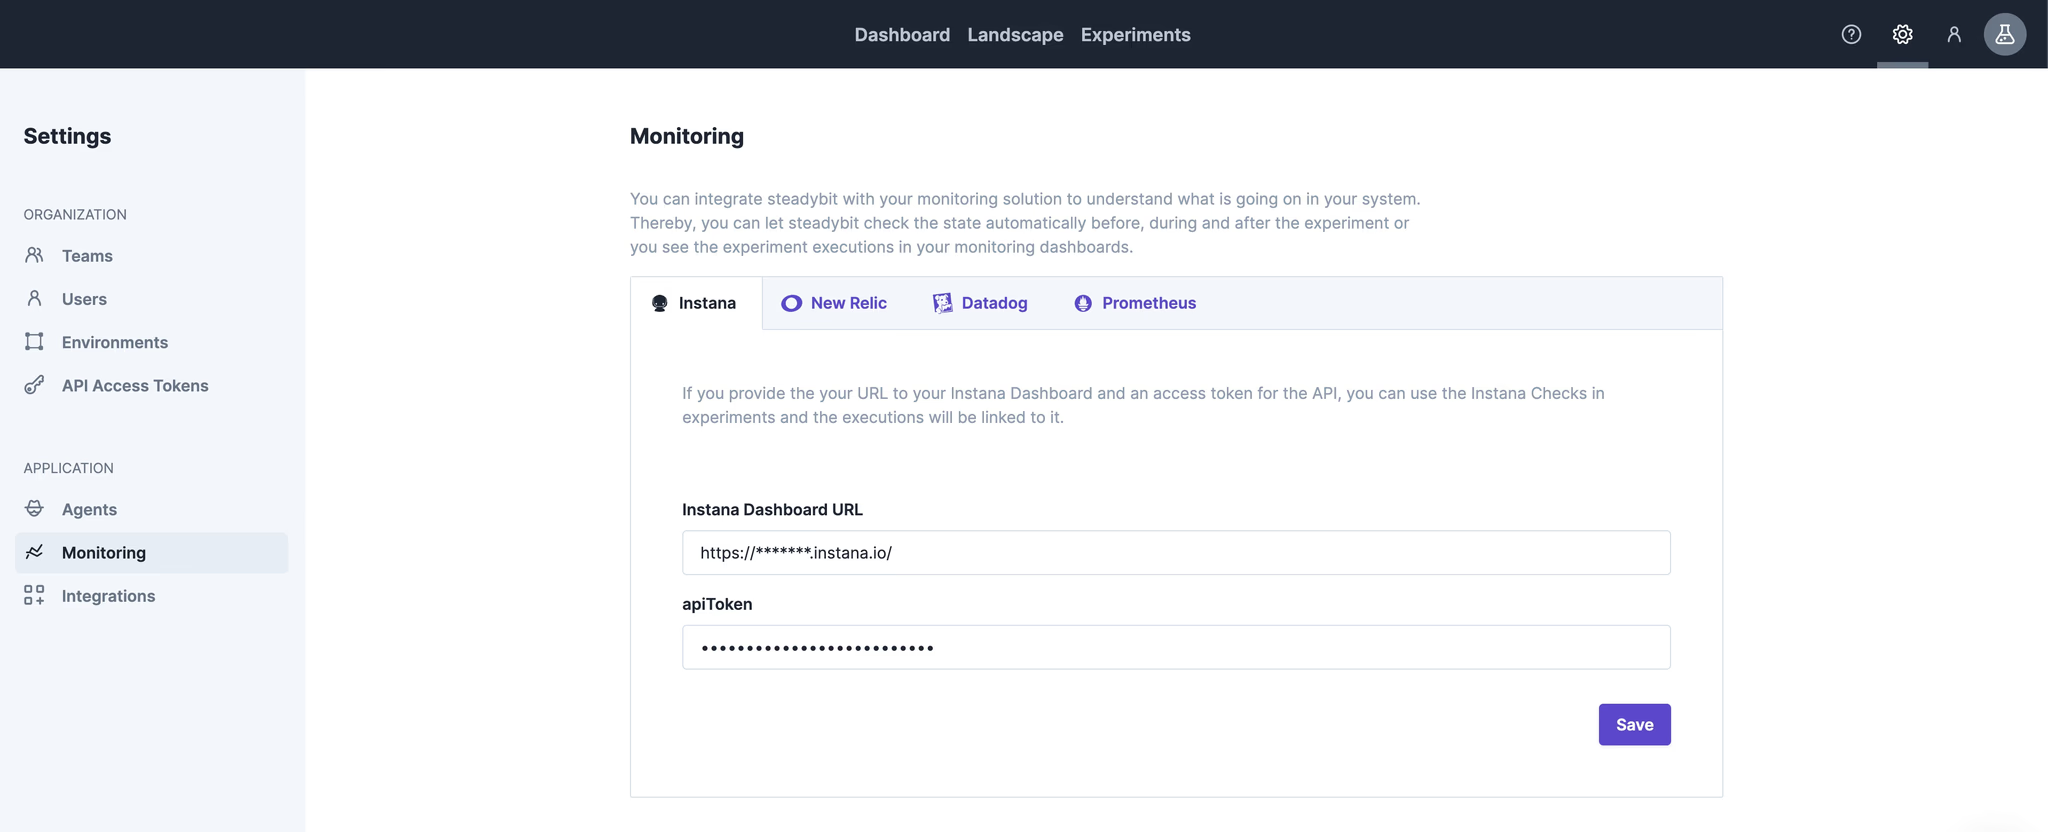
Configuration
In our Steadybit platform goto to Settings/Monitoring.
Within this section you can specify the Instana base URL and the API token that was previously created in Instana. That’s all we need to react to the events and incidents in Instana.
Experiments with monitoring / Instana
Once Instana has been configured, you can watch the Instana Event Log.
Instana Event Log
In the Instana Event Log you can see all events that occurred during the experiment execution. You don’t have to configure anything on the experiment – when Instana is configured in the platform settings, the events are automatically observed for each experiment.


Conclusion
That’s it already! Track how all data streams converge and take advantage of this connection in terms of security and control when running chaos experiments.
Want to learn more about it? Just book a demo or try it out your self, we are looking forward to it.

Get started today
Full access to the Steadybit Chaos Engineering platform.
Available as SaaS and On-Premises!
or sign up with

Book a Demo
Let us guide you through a personalized demo to kick-start your Chaos Engineering efforts and build more reliable systems for your business!